Sections of a Scientific Report (OCR A-Level Psychology): Revision Notes
📚 Revision Notes
7.3.4 Sections of a Scientific Report
Mathematical Content
Calculating a percentage – (Number of participants [who…] / total number of participants) x 100
Percentage to decimal – Divide % by 100 (37% = 0.37)
Decimal to fraction – Work out a total number of decimal places. If there are 2 you divide by 100. If 3 you divide by 1000.
Using ratios – Reduced like a fraction, finding a lowest common denominator
Probability – 5% accepted level in psychology. P<0.05: 95% chance results were due to IV change.
Measures of Central Tendency
- Mean – (average) adding up all scores and dividing by the number of values there are. Most sensitive of the measures of central tendency as it includes all the values in the data set which means it is more representative however easily distorted by extreme values.
- Median – (middle value) Central value in a set of data when values are arranged from lowest to highest. Extreme scores do not affect the median, less sensitive than the mean as it does not include all scores in the final calculation.
- Mode – Most frequently occurring variable.
Measures of Dispersion
- Range – taking the lowest value away from the highest, (and adding one to allow for the fact raw scores are often rounded). Easy to calculate however unrepresentative of other scores as it only takes two values into account.
- Standard deviation – a score that tells us how far scores move away from the mean. The larger the SD the greater the dispersion. A low SD reflects data clustered around the mean. More precise as includes all values but can be distorted by an extreme value.
Presentation and display of Quantitative Data
- Summary Table – raw scores converted to descriptive statistics. It is standard practice to include a summary paragraph beneath the table explaining the results.
- Bar Chart – a type of graph in which the frequency of each variable is represented by the height of bars. Used when data is divided into categories (discrete data).
- Scatter gram – represents the strength and direction of a relationship between co-variables in a correlational analysis.
Distributions
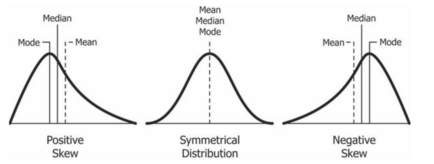
- Normal Distribution – a symmetrical spread of frequency data that forms a bell-shaped curve with the mean, median and mode located at the highest peak.
- Skewed Distribution – a spread of frequency data that is not symmetrical, where data clusters to one end. Positive skew – when most data is clustered towards the left of the graph, leaving a long tail towards the right. Negative skew – most data is clustered towards the right, leaving a long tail towards the left.