Rate Graphs (AQA GCSE Chemistry): Revision Notes
📚 Revision Notes
6.1.3 Rate Graphs
Rate Graphs
infoNote
Rate graphs are visual tools used to show how the amount of reactants or products changes over time during a reaction. These graphs help us see how quickly a reaction is happening at different stages.
Understanding the Curves:
infoNote
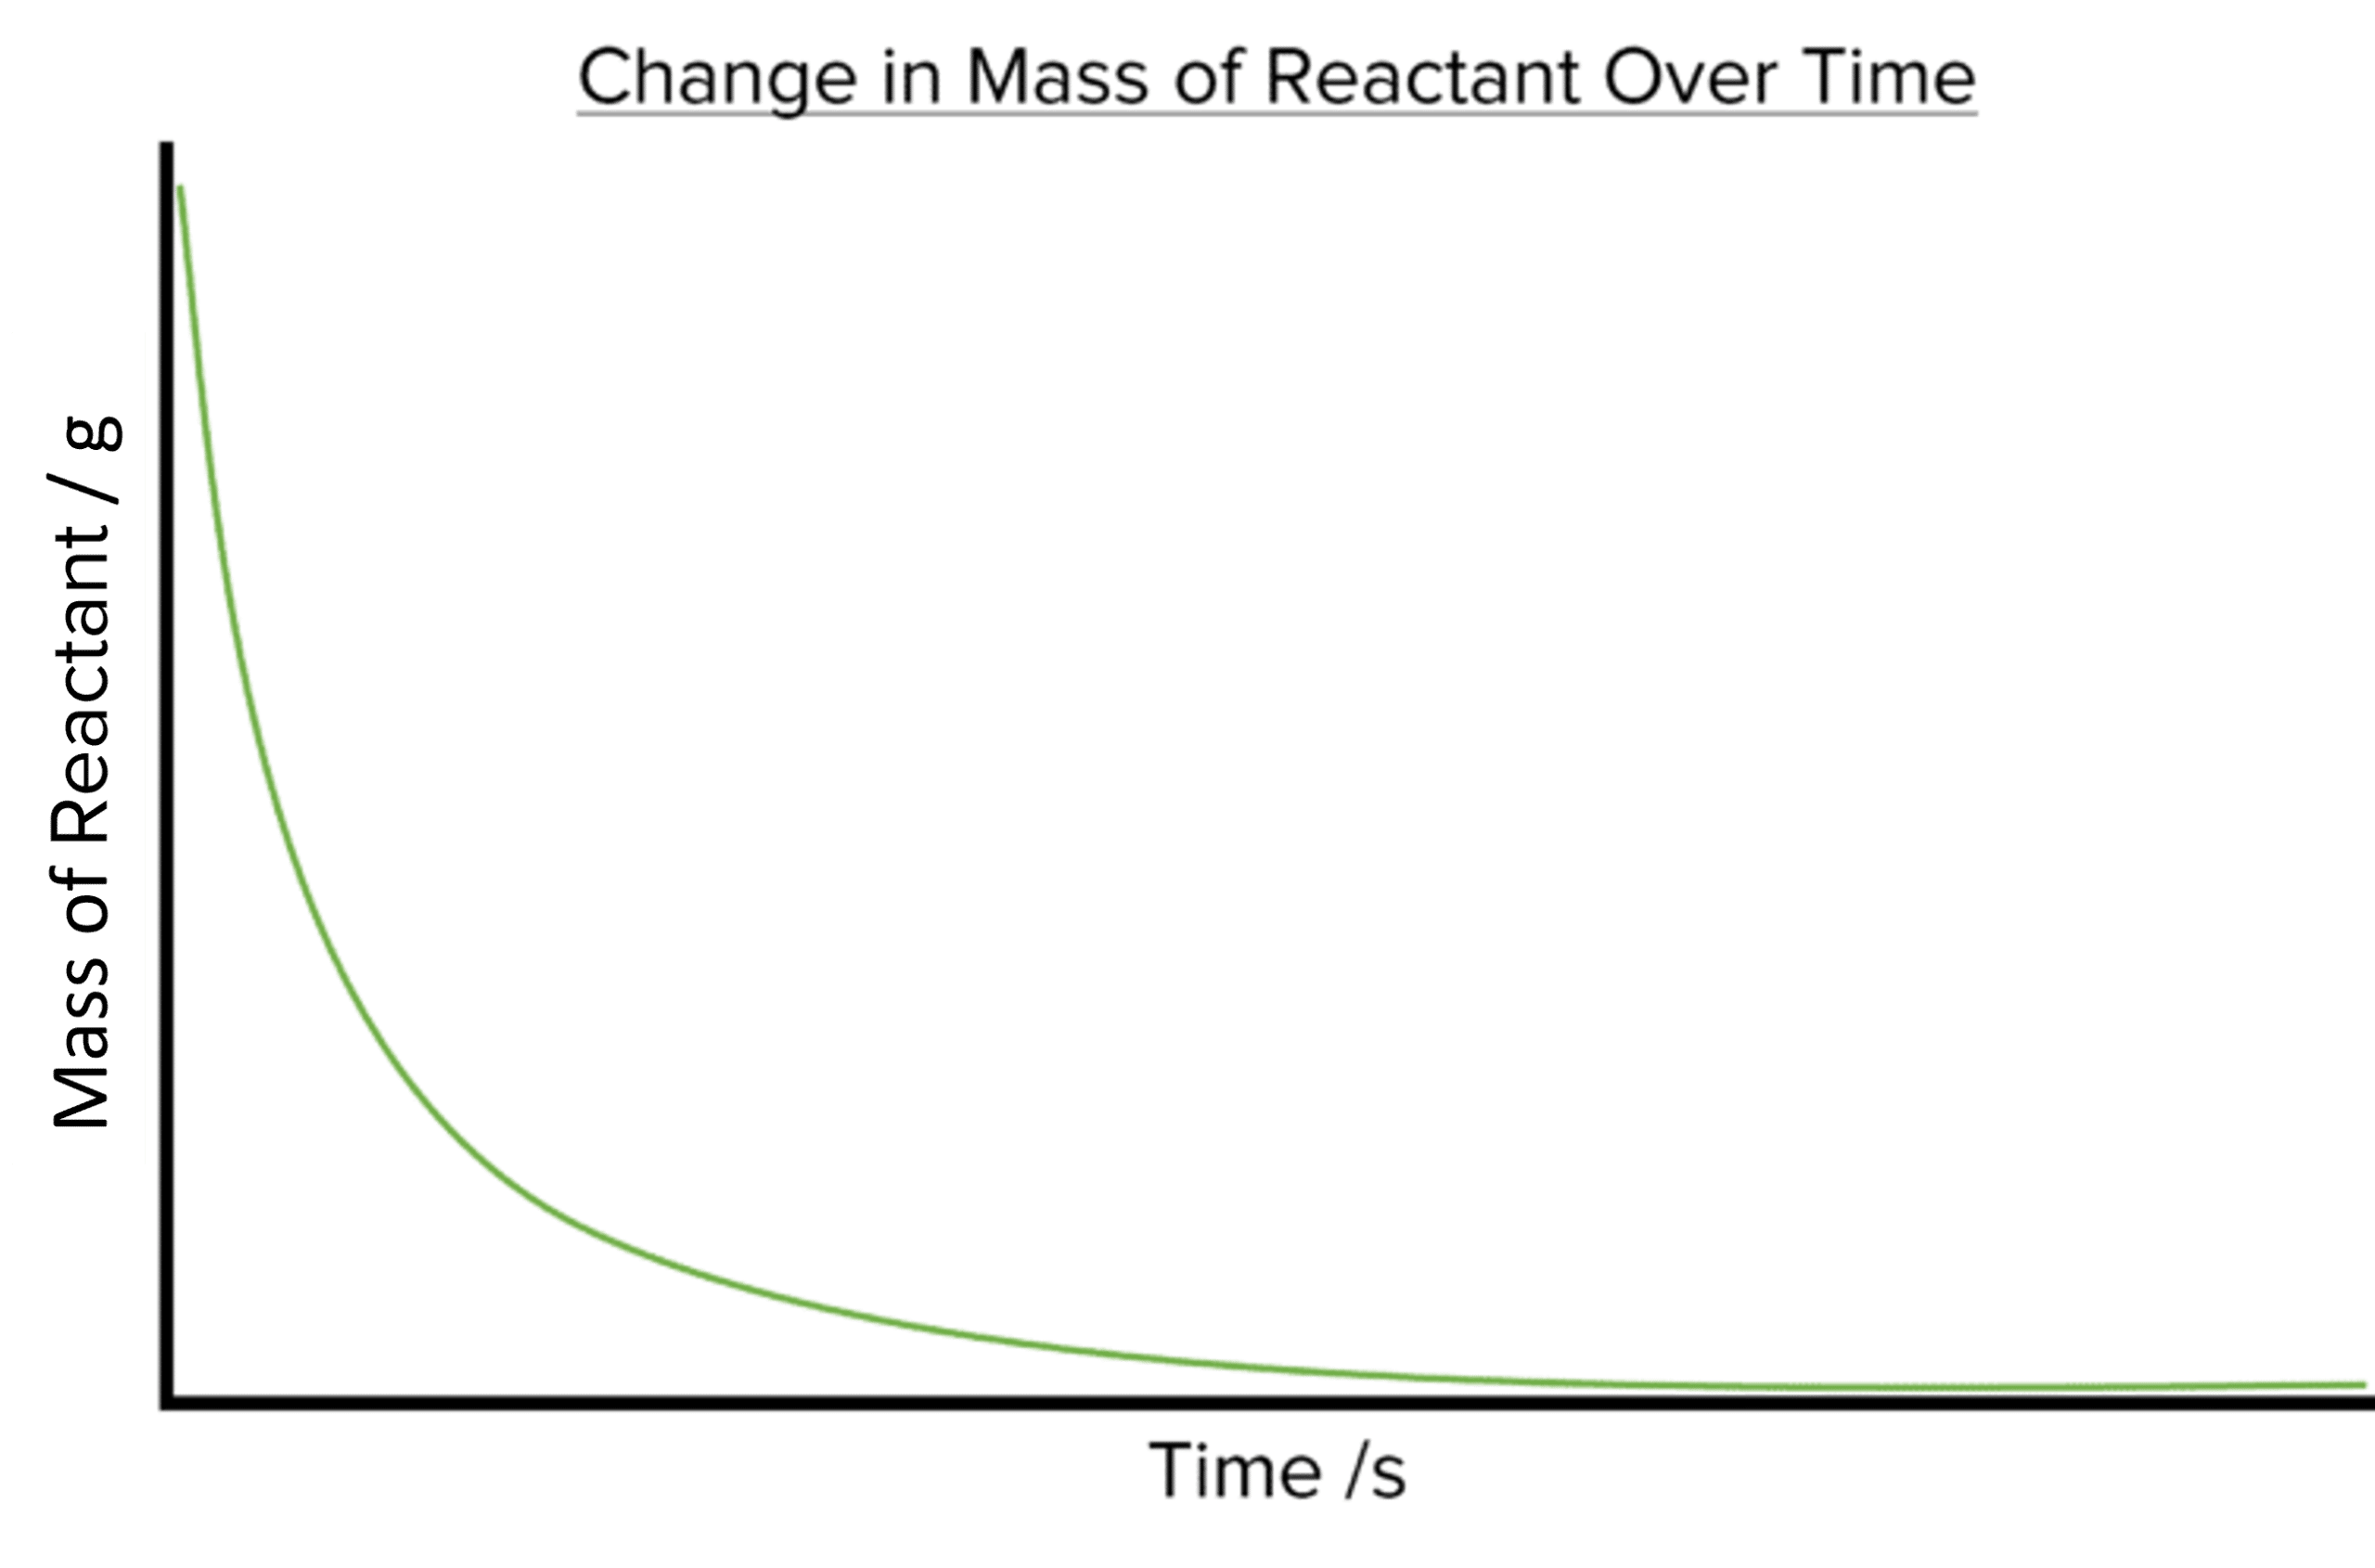
Rate graphs often show curves because the rate of reaction changes as the reaction progresses.
-
Reactant Curve: If you plot the amount of reactant leftover time, the curve will slope downwards because the reactants are being used up.
-
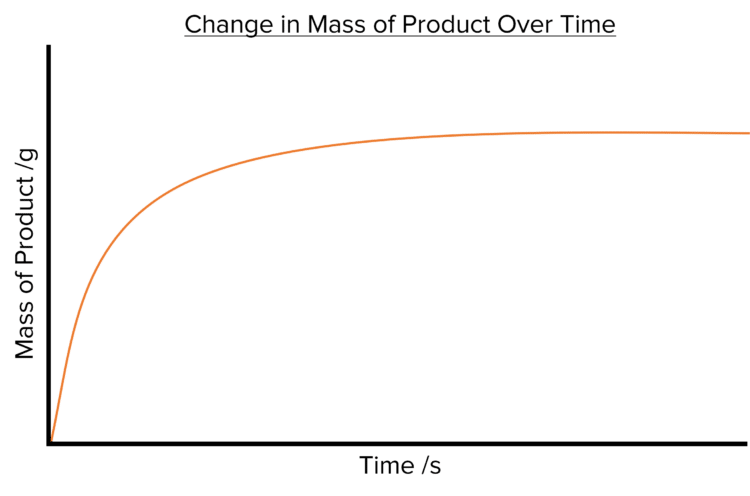
Product Curve: If you plot the amount of product formed over time, the curve will slope upwards because more product is being made as time goes on.
-
Steepness of the Curve:
- At the beginning of the reaction, the curve is steepest because the reaction is fastest here. This is when there are plenty of reactant particles available to collide and react.
- As the reaction continues, the curve becomes less steep because the reactants get used up, so there are fewer particles to collide, slowing down the reaction.
- Eventually, the curve flattens out (plateaus) when the reaction stops, meaning no more reactants are left or the system has reached equilibrium.
infoNote
Calculating the Rate of Reaction from a Graph:
- To find the rate of reaction at a specific point on a rate graph, you need to calculate the gradient (slope) of the curve at that point.
- Drawing a Tangent:
- A tangent is a straight line that just touches the curve at a specific point without crossing it.
- By drawing a tangent to the curve at the point where you want to find the rate, you can measure the change in the amount (y-axis) over the change in time (x-axis).
- Calculating the Gradient:
- The gradient (and hence the rate of reaction) is calculated as:
- This gives you the rate of reaction at that specific point in time.
lightbulbExample
Example:
- If a tangent on a rate graph shows that 10 cm³ of gas is produced over 2 seconds, the rate of reaction at that point is: