Distance-Time Graphs (AQA GCSE Maths): Revision Notes
Distance-time graphs
Distance-time graphs might seem a bit tricky at first, but once you understand the key principles, they become much easier to work with. These graphs are incredibly useful for analysing journeys and understanding motion patterns.
Understanding the basics
A distance-time graph shows how far an object has travelled from its starting point over a period of time. The horizontal axis (x-axis) represents time, whilst the vertical axis (y-axis) shows the distance from the starting position.
Understanding the axes is crucial - time always goes along the horizontal axis, and distance is measured vertically from the starting point.
Key principles you need to remember
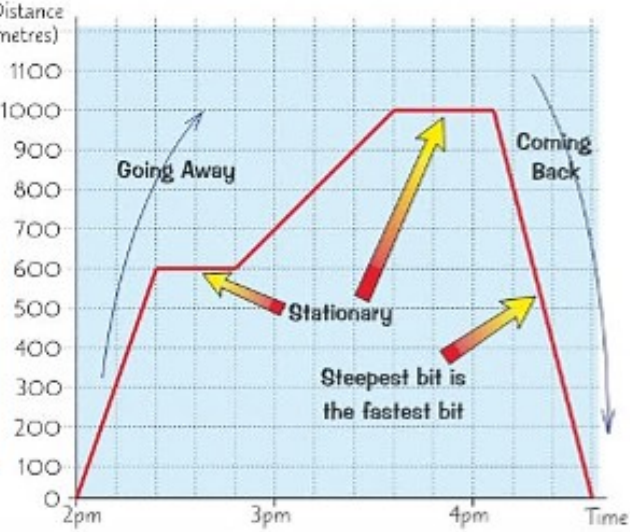
There are four essential rules that will help you interpret any distance-time graph successfully:
1. Gradient equals speed
The steepness of the line on a distance-time graph directly tells you about the speed of movement. When you calculate the gradient of any section, you're actually finding the speed during that part of the journey.
2. Steeper means faster
The more vertical the line appears, the faster the object is moving. A very steep line indicates rapid movement, whilst a gentler slope shows slower motion.
3. Flat sections show stationary periods
When the line runs horizontally (completely flat), this means the object has stopped moving. During these periods, the distance from the starting point remains constant because there's no movement happening.
4. Negative gradients indicate return journeys
When the line slopes downwards from left to right, this shows the object is returning towards its starting point. The steeper this downward slope, the faster the return journey.
Common Mistake Alert: Students often confuse distance-time graphs with speed-time graphs. Remember: in distance-time graphs, the gradient gives you speed, not the height of the line!
Working with calculations
Finding speed from the graph
To calculate speed from a distance-time graph, you need to find the gradient of the relevant section. Use the formula:
Remember to be careful with your units - if distance is in kilometres and time is in hours, your speed will be in km/h.
Working out journey times
Sometimes you'll need to calculate how long a particular part of a journey takes. You can rearrange the speed formula:
This is particularly useful when you know the speed and distance but need to find the duration.
Unit Consistency: Always check that your units match throughout your calculations. Mixed units (like metres and kilometres) will give you incorrect answers.
Practical example analysis
Let's look at a real example to see how these principles work in practice.
Worked Example: Analysing Henry's Cycling Journey
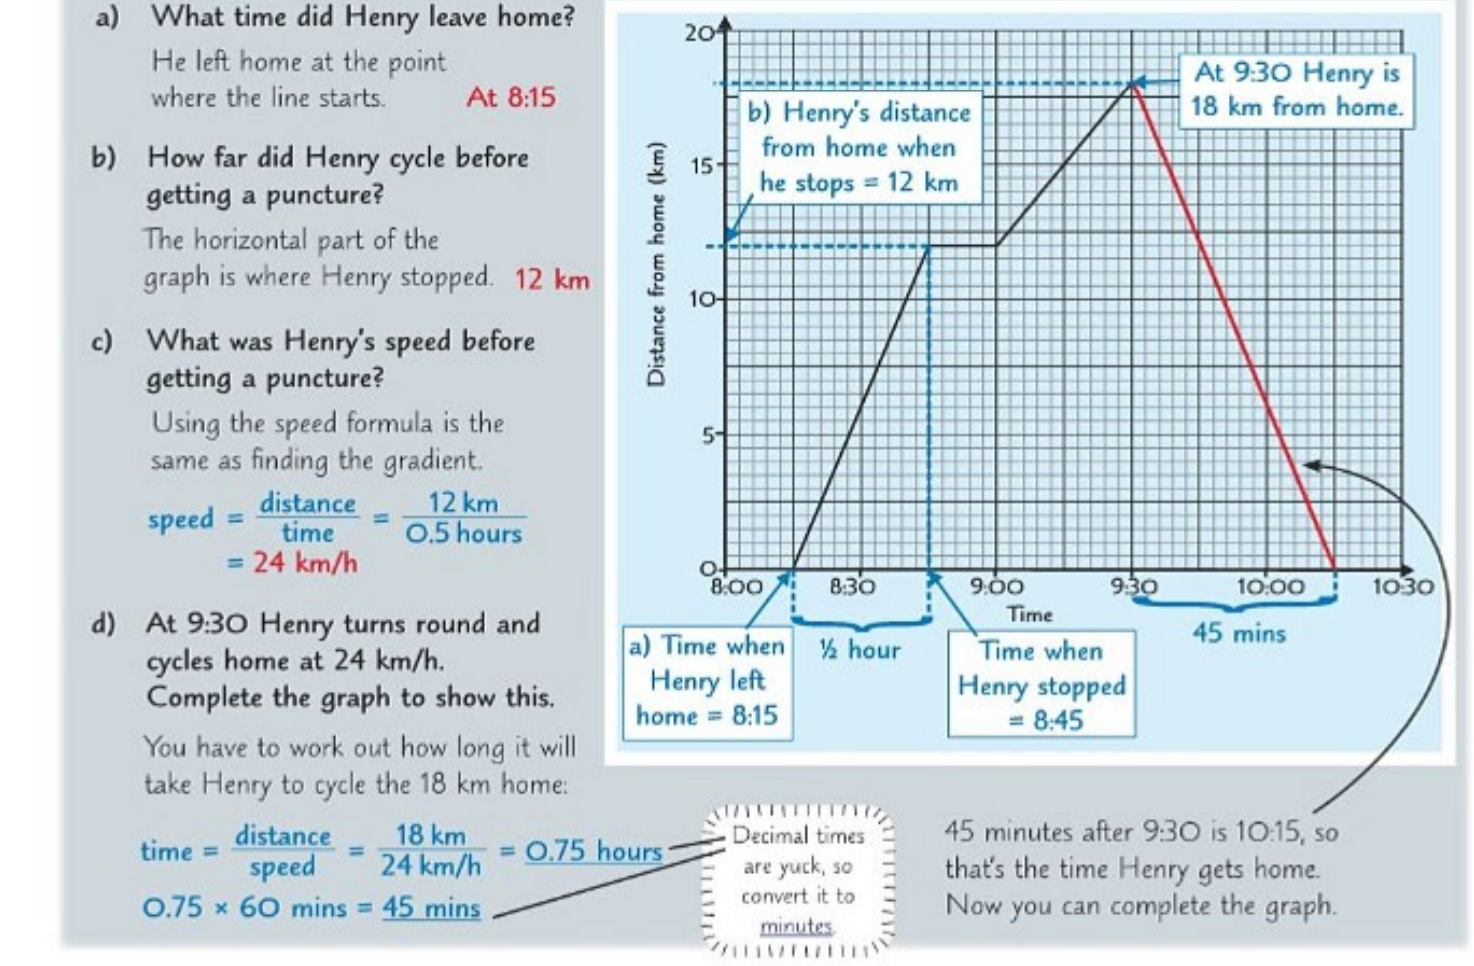
This graph shows Henry's cycling journey, which demonstrates several key concepts:
Step 1: Identify the departure time By looking at where the line starts to rise from the horizontal axis, you can determine when Henry left home.
Step 2: Find the distance before stopping The horizontal section shows where Henry stopped to fix his puncture - the distance at this point tells you how far he'd travelled (12 km).
Step 3: Calculate the speed Using the gradient of the sloping sections:
- Distance travelled: 12 km
- Time taken: 0.5 hours
- Speed = 12 km ÷ 0.5 hours = 24 km/h
Step 4: Determine return journey time Using the calculated speed, you can determine how long the return journey should take.
Tips for success
Essential Tips for Working with Distance-Time Graphs:
When working with distance-time graphs, always:
- Read the axis labels carefully to understand the units
- Look for flat sections to identify when the object was stationary
- Use the gradient to find speed - steeper lines mean faster movement
- Remember that downward slopes indicate return journeys
- Show your working clearly when doing calculations
Key Points to Remember:
- Gradient = Speed - the steepness of the line tells you how fast something is moving
- Flat sections = Stationary - horizontal lines show when the object has stopped
- Steeper = Faster - the more vertical the line, the greater the speed
- Negative gradient = Coming back - downward slopes show return journeys towards the starting point
- Practice makes perfect - the more graphs you work with, the easier they become to interpret