Gradients of Real-Life Graphs (AQA GCSE Maths): Revision Notes
Gradients of Real-Life Graphs
What gradients represent
Gradient is a powerful concept that tells you important information about what's happening in real-life situations. Whether you're looking at acceleration, growth rates, or speed, the gradient always represents the rate of change.
The key principle to remember is simple: the gradient of a graph represents the rate. This applies to any graph, regardless of what variables you're measuring.
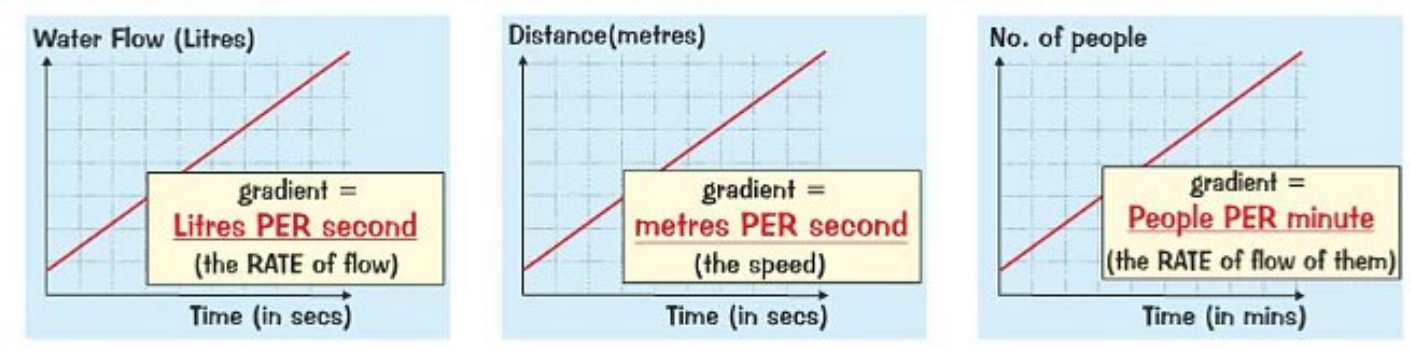
No matter what type of graph you're working with, the meaning of the gradient follows the same universal format: (y-axis UNITS) PER (x-axis UNITS). This means:
-
Water flow graph: gradient = litres per second (rate of flow)
-
Distance-time graph: gradient = metres per second (speed)
-
Population graph: gradient = people per minute (rate of change in population)
This universal format helps you understand what any gradient means in practical terms. Always identify what units you're measuring on each axis first.
Finding the average gradient
When you need to find the average gradient between two points on a curve, follow these steps:
-
Draw a straight line connecting the two points
-
Calculate the gradient of this straight line using the formula
The mathematical formula for gradient is:
Worked Example: Sunflower Growth
Vicky records her sunflower's height daily and wants to find the average growth rate between days 40 and 80.
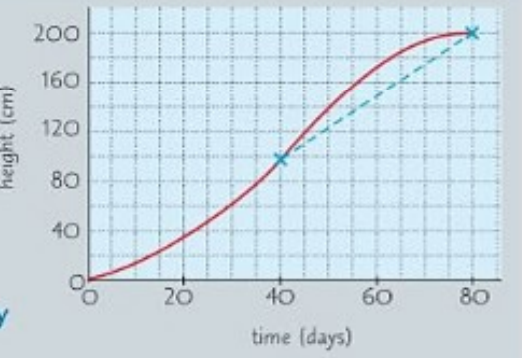
Step 1: Draw a straight line between the points at day 40 and day 80
Step 2: Calculate the gradient:
-
Change in y = 200 - 100 = 100 cm
-
Change in x = 80 - 40 = 40 days
-
Gradient = cm per day
Result: The sunflower grows at an average rate of 2.5 cm per day between days 40 and 80.
Estimating the rate at a given point
To find the rate at a specific point on a curve, you need to draw a tangent line. A tangent is a straight line that touches the curve at exactly one point. The gradient of this tangent gives you the instantaneous rate at that point.
Remember: A tangent line touches the curve at exactly one point and represents the rate at that precise moment.
Worked Example: Cycling Speed
Dan wants to estimate his speed after 40 minutes of cycling.
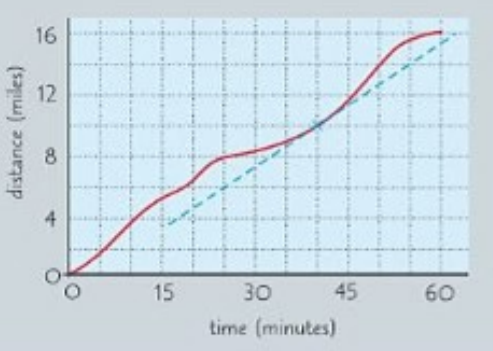
Step 1: Draw a tangent to the curve at the 40-minute mark
Step 2: Calculate the gradient of the tangent:
-
Change in y = 14 - 10 = 4 miles
-
Change in x = 55 - 40 = 15 minutes
-
Gradient = miles per minute
Step 3: Convert to appropriate units:
miles per minute = 16 miles per hour
Result: Dan's speed after 40 minutes is 16 miles per hour.
Key calculation tips
When working with gradients in real-life graphs, keep these important points in mind:
-
Always check your units - they should make sense for what you're measuring
-
Remember the gradient formula:
-
For curved graphs, use tangents to find rates at specific points
-
For average rates, use straight lines between two points
-
Keep a ruler handy for drawing accurate lines
Units Check: If you're measuring speed and your answer comes out in "metres per square second" or something that doesn't make physical sense, double-check your calculation!
Key Points to Remember:
-
The gradient of any graph represents a rate - always expressed as y-axis units per x-axis units
-
Average gradient is found by drawing a straight line between two points and calculating its gradient
-
Instantaneous rate is found by drawing a tangent at a specific point and calculating its gradient
-
Always check your units - they should make practical sense for the situation
-
Use the formula: Gradient =