Quadratic Graphs (AQA GCSE Maths): Revision Notes
Quadratic graphs
Quadratic graphs are one of the most important types of curves you'll encounter in GCSE mathematics. Understanding their properties and how to work with them is essential for success in your exams.
What are quadratic graphs?
Quadratic functions are written as equations that include x² as the highest power, but no higher powers of x. This means they follow the general pattern of where .
All quadratic graphs share the same fundamental characteristic - they create a symmetrical U-shaped curve called a parabola. You can think of this shape as resembling a bucket, which makes it easy to remember.
The bucket analogy is particularly helpful for remembering the shape. Just like a bucket can hold water when upright or spill it when turned upside down, parabolas can open upward or downward depending on their equation.
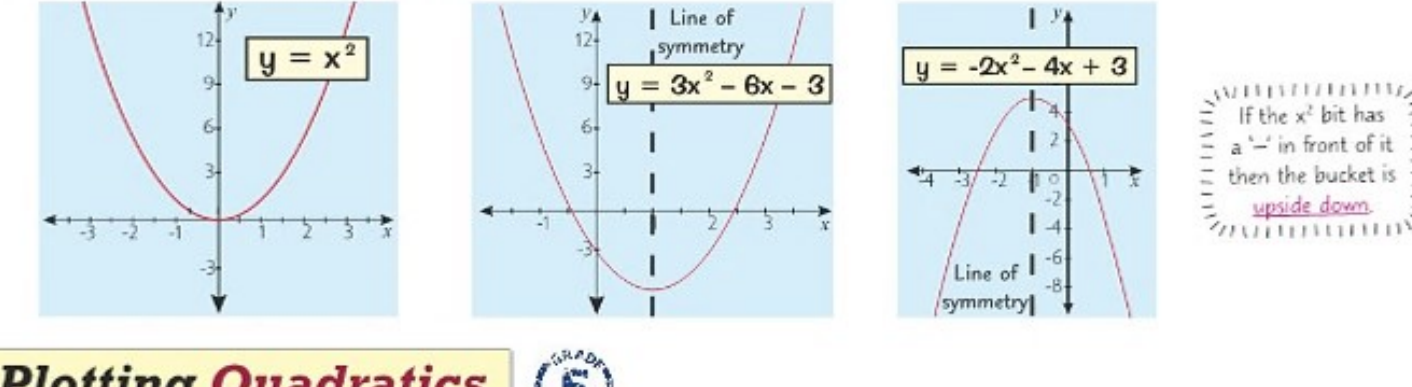 The direction the parabola opens depends on the coefficient (number) in front of the x² term. When this coefficient is positive, the parabola opens upward like a normal bucket. However, when the coefficient is negative (has a minus sign), the parabola opens downward, creating what looks like an upside-down bucket.
Plotting quadratic graphs using tables
One reliable method for drawing quadratic graphs involves creating a table of values and plotting the resulting points. This systematic approach ensures accuracy and helps you understand the curve's behaviour.
Step-by-step plotting process
When plotting a quadratic graph, you'll typically start with a table showing x-values and their corresponding y-values. For each x-value, substitute it into the equation to calculate the y-value. This gives you coordinate pairs that you can plot on a coordinate grid.
Worked Example: Plotting y = x² - 4x + 3
| x | -1 | 0 | 1 | 2 | 3 | 4 | 5 |
|---|---|---|---|---|---|---|---|
| y | 8 | 3 | 0 | -1 | 0 | 3 | 8 |
Step 1: Calculate y-values
- For x = -1: y = (-1)² - 4(-1) + 3 = 1 + 4 + 3 = 8
- For x = 0: y = (0)² - 4(0) + 3 = 0 - 0 + 3 = 3
- For x = 1: y = (1)² - 4(1) + 3 = 1 - 4 + 3 = 0
Step 2: Plot the coordinate pairs on a grid Step 3: Join with a smooth curve
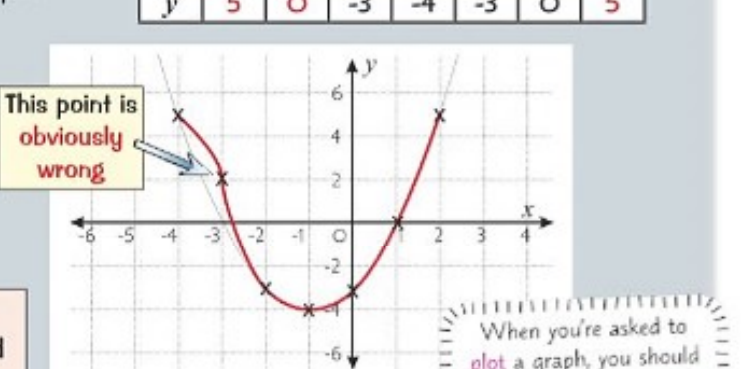 Once you've plotted all your points, join them with a completely smooth curve. This is crucial - quadratic graphs should never have sharp corners, spikes, or bumps. If one point seems dramatically different from the others, it's likely an error in your calculations rather than a genuine feature of the graph.
Critical Rule: When a graph comes from an equation, you should never get irregular features like sharp corners or spikes. Always double-check any points that don't seem to fit the smooth curve pattern - there's likely a calculation error.
Sketching quadratic graphs
Sometimes you'll be asked to sketch a quadratic graph rather than plot it precisely. This means you can focus on finding the most important features without needing graph paper or exact plotting.
Finding the key features
When sketching a quadratic, you need to identify three essential elements: the x-intercepts (where the curve crosses the x-axis), the turning point (the highest or lowest point), and the general shape.
 To find the x-intercepts, set the equation equal to zero and solve for x. For example, if you have , you'd solve . This often involves factoring the quadratic expression.
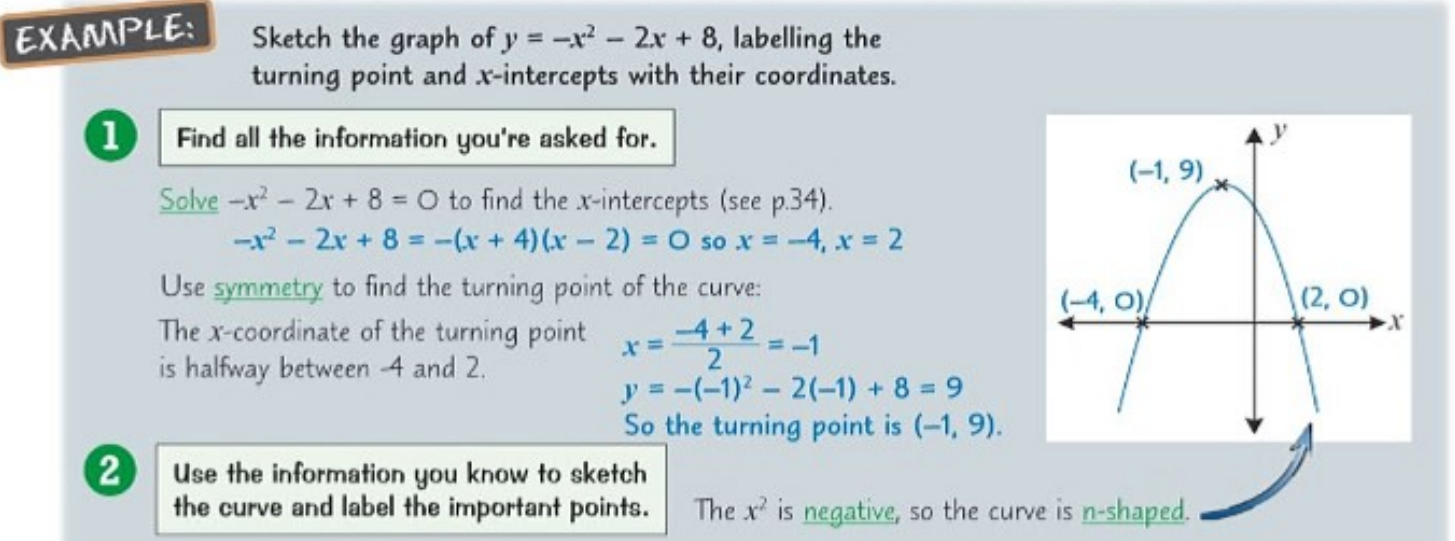
Worked Example: Finding x-intercepts for y = -x² - 2x + 8
Step 1: Set y = 0
Step 2: Multiply by -1 to make factoring easier
Step 3: Factor the quadratic
Step 4: Solve for x or
So the x-intercepts are at (-4, 0) and (2, 0).
The turning point can be found using the symmetry of parabolas. Since quadratic graphs are perfectly symmetrical, the turning point sits exactly halfway between the two x-intercepts. Once you know the x-coordinate of the turning point, substitute it back into the original equation to find the y-coordinate.
For the example above, the turning point x-coordinate is: Substituting back: So the turning point is at (-1, 9).
Understanding symmetry in quadratic graphs
Symmetry is a powerful tool when working with quadratic graphs. Every parabola has a vertical line of symmetry that passes through its turning point. This line divides the curve into two identical halves.
You can use this symmetry to your advantage when sketching. If you know where the turning point is, you can find corresponding points on either side of the line of symmetry. This helps ensure your sketch is accurate and properly shaped.
The line of symmetry has the equation for a quadratic in the form . This formula gives you the x-coordinate of the turning point directly.
The effect of the x² coefficient
The coefficient of x² in your equation determines not just the direction the parabola opens, but also how steep or wide it appears. A larger positive coefficient makes the parabola narrower and steeper, while a smaller positive coefficient makes it wider and more gradual.
When the coefficient is negative, the parabola flips upside down. This creates an n-shaped curve instead of a u-shaped one. The turning point in this case becomes the maximum point rather than the minimum point.
Understanding the coefficient:
- If : parabola opens upward (U-shape), turning point is a minimum
- If : parabola opens downward (∩-shape), turning point is a maximum
- Larger |a| values create steeper, narrower parabolas
- Smaller |a| values create wider, more gradual parabolas
Drawing smooth curves
One of the most important aspects of quadratic graphs is ensuring they're drawn as smooth, continuous curves. Real quadratic graphs never have sharp points, flat sections, or sudden changes in direction.
When you're plotting points from a table, you should be able to join them with one flowing curve. If your plotted points suggest sharp corners or irregular shapes, check your calculations - there's likely an error in your work.
Common Mistake to Avoid: Never draw quadratic graphs with straight line segments connecting the points. The curve should flow smoothly through all plotted points without any sharp corners or sudden direction changes.
Key Points to Remember:
- Quadratic graphs are always U-shaped or upside-down U-shaped (parabolas)
- The sign of the x² coefficient determines whether the parabola opens upward (positive) or downward (negative)
- All quadratic graphs have a line of symmetry passing through their turning point
- When plotting, always join points with a smooth curve - never include spikes or sharp corners
- You can sketch quadratic graphs by finding x-intercepts and the turning point, then using symmetry to complete the shape
- The turning point is always halfway between the x-intercepts
- Use the formula to find the line of symmetry quickly