Real-Life Graphs (AQA GCSE Maths): Revision Notes
Real-life graphs
Real-life graphs help us understand how different situations change over time or how costs vary with usage. These graphs are much more practical than simple mathematical equations because they show us patterns we encounter in everyday life.
Understanding billing structures
Many bills you encounter in real life follow a two-part structure that combines a fixed charge with a cost per unit. This means you pay a basic amount regardless of how much you use, plus an additional charge for each unit you consume beyond a certain limit.
For example, mobile phone bills often work this way - you might pay a fixed monthly fee that includes a certain amount of data, and then pay extra for each gigabyte you use beyond that allowance.
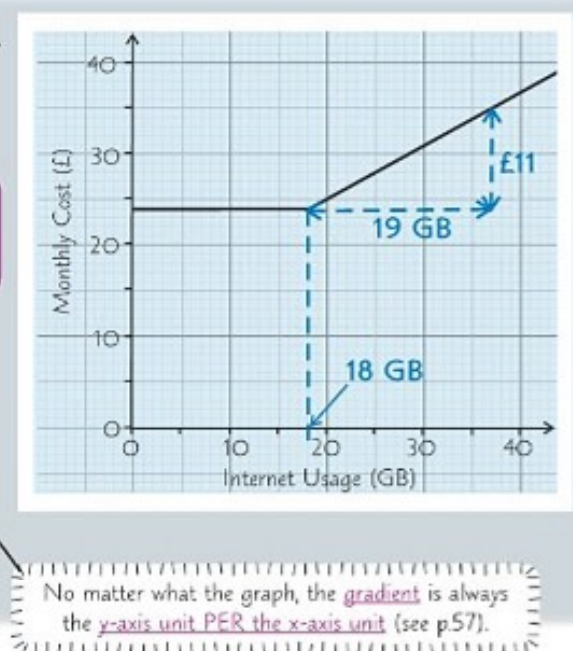
When looking at billing graphs, the first section is typically horizontal, showing that you pay the same amount regardless of usage up to a certain point. Once you exceed that limit, the graph becomes sloped, showing the additional cost per unit.
To calculate the cost per additional unit, you need to find the gradient of the sloped section. The gradient tells you how much the cost increases for each additional unit consumed.
Calculating gradient from billing graphs
The gradient calculation follows a simple formula: divide the vertical change by the horizontal change. This gives you the rate of change, which in billing contexts represents the cost per additional unit.
Worked Example: Finding Cost Per GB
If the cost increases by £11 when usage increases by 19 GB:
Step 1: Apply the gradient formula
Step 2: Substitute the values
Step 3: Round to the nearest penny Cost per GB = £0.58
Remember that gradient always represents the y-axis unit per x-axis unit, regardless of what the graph shows. In billing graphs, this means pounds per unit of consumption.
Graphs showing changes with time
Physical shapes and containers create different patterns when we graph how they change over time. This is particularly clear when looking at how liquid drains from different shaped containers.
 When liquid drains from containers at a constant rate, the shape of the container determines how quickly the height changes. Understanding this relationship helps you match physical situations to their corresponding graphs.
Container shapes and drainage patterns
Different container shapes produce distinct graph patterns:
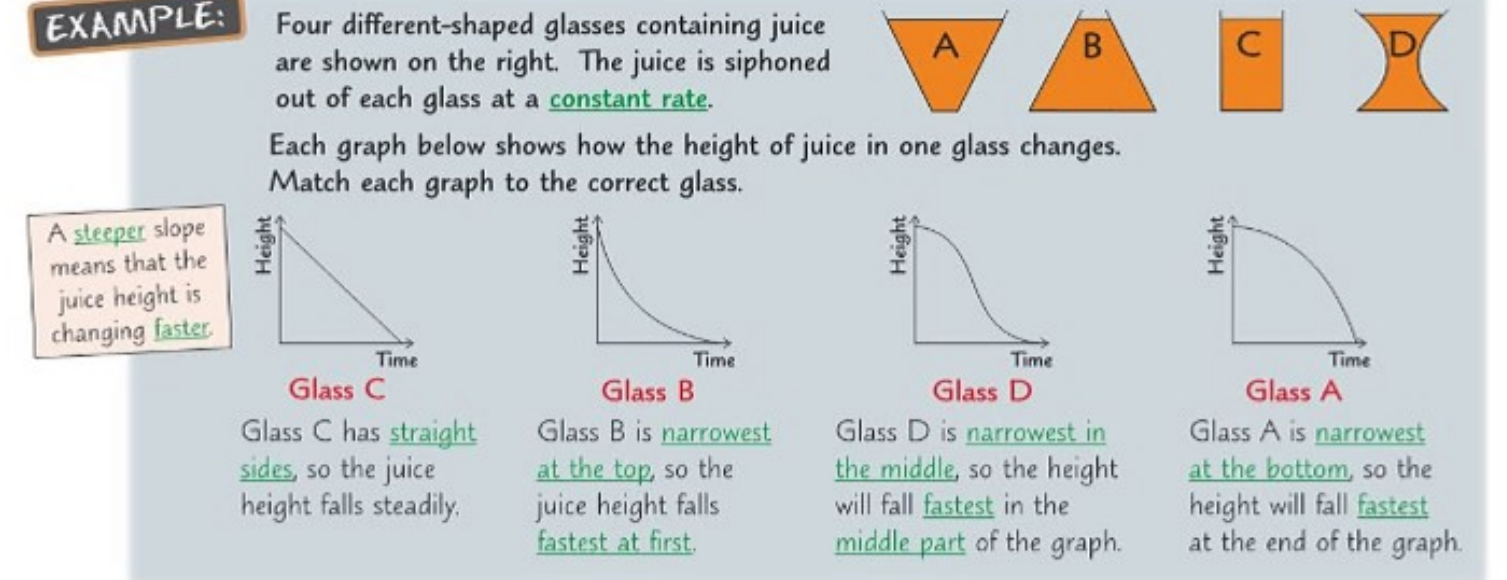
The key principle is that steeper slopes on the graph indicate faster changes in height. When a container is narrow, the liquid level drops quickly, creating a steep slope. When a container is wide, the liquid level drops slowly, creating a gentle slope.
- Cylindrical containers (straight sides) create linear graphs because the width stays constant, so the height decreases at a steady rate
- Containers that are wider at the bottom create curved graphs that start steep and become more gradual, as the height drops quickly when there's less liquid
- Containers that are wider at the top create graphs that start gradually and become steeper, as the height drops more slowly initially then faster as the container narrows
- Containers with varying widths (like an hourglass shape) create more complex curved patterns that reflect the changing width at different heights
This relationship between physical shape and graph pattern appears in many real-life situations, from filling swimming pools to monitoring water levels in reservoirs.
Critical Concept: Container width affects drainage speed - narrow sections create steep graph slopes, wide sections create gentle slopes. This principle applies to any situation where shape affects the rate of change.
Key Points to Remember:
- Billing graphs often show two parts: a flat section for included usage and a sloped section for additional costs
- Gradient calculation: represents the rate of change
- Container width affects drainage speed: narrow sections create steep graph slopes, wide sections create gentle slopes
- Steeper slopes always mean faster changes regardless of what the graph represents
- Physical shapes directly influence graph patterns - understanding the shape helps predict the graph