Describing data (AQA GCSE Statistics): Revision Notes
Describing data
When working with statistics, you need to understand the different ways we can classify and describe the information we collect. This knowledge helps you choose the right methods for analysis and presentation.
Understanding raw data
Raw data refers to information as it's initially gathered during a statistical investigation, before any sorting, organising, or processing takes place. Think of it as the "unpolished" version of your data - straight from the source.
Raw Data Definition: Raw data is data as it is first collected in a statistical investigation, before it has been sorted or ordered. It represents the original, unprocessed information from your data collection.
When we describe data, we focus on the variables that have been collected. These variables might represent things like the colour of cars in a car park, people's heights, the number of goals scored in football matches, or how long different journeys take.
Types of data
Data can be classified into two main categories based on what type of information it represents: quantitative data and qualitative data.
Quantitative data
Quantitative data consists of numerical measurements - essentially, anything you can count or measure with numbers. This includes measurements like height, weight, temperature, time, and scores.
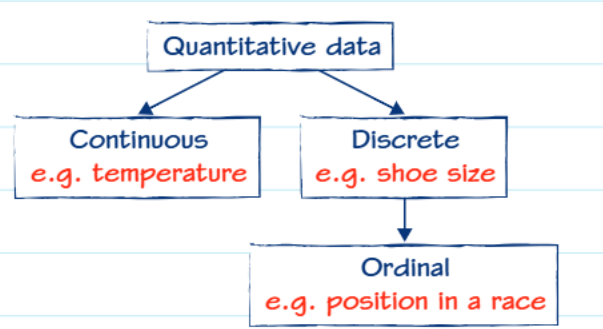
Quantitative data can be further divided into two important subcategories:
Continuous data
Continuous data can take any value within a given range and can be measured to any degree of precision. Temperature is a perfect example - it could be 20.5°C, 20.53°C, or 20.534°C depending on how accurately you measure it.
Worked Example: Identifying Continuous Data
Consider measuring the height of students in a class:
- Student A: 165.2 cm
- Student B: 165.23 cm
- Student C: 165.234 cm
The height could theoretically be measured to any level of precision (165.2345... cm), making this continuous data.
Other examples: weight, time, distance, temperature
Discrete data
Discrete data can only take specific, separate values, usually whole numbers. Shoe size is a good example because you can wear a size 7 or size 8, but not a size 7.3. The number of people in a room is another example - you can have 15 or 16 people, but never 15.5 people.
Ordinal data
Ordinal data is a special type of discrete data where the values have a natural order or ranking.
Understanding Ordinal Data
Ordinal data has two key characteristics:
- The values can be arranged in a meaningful order
- The gaps between values are not necessarily equal
For example, race positions (1st, 2nd, 3rd) show order, but the time difference between 1st and 2nd place might be very different from the difference between 2nd and 3rd place.
Qualitative data
Qualitative data describes characteristics, qualities, or categories rather than numerical amounts. This type of information tells us about the nature or type of something rather than how much or how many.
Categorical data
All qualitative data is essentially categorical data because it sorts information into different categories or groups. For instance, if you collected information about where people went on holiday last year, you might categorise the responses by continent: Europe, Asia, North America, South America, Africa, Australia, and Antarctica. Each person's response would fit into one of these categories.
Qualitative vs Quantitative Quick Check
Ask yourself: "Can I do meaningful arithmetic with this data?"
- If yes → Quantitative (e.g., heights: you can calculate average height)
- If no → Qualitative (e.g., hair colours: averaging "brown" and "blonde" doesn't make sense)
Related data
Sometimes statistical investigations collect information about multiple variables for the same subjects, creating relationships between different pieces of data.
Bivariate data
Bivariate data involves collecting pairs of related information. For instance, you might record both exam results and the time spent studying for each student. This creates pairs of values that can help you investigate whether there's a relationship between study time and exam performance.
Worked Example: Bivariate Data Collection
A teacher wants to investigate if there's a relationship between study time and exam scores:
| Student | Study Time (hours) | Exam Score (%) |
|---|---|---|
| Alice | 8 | 85 |
| Bob | 5 | 72 |
| Charlie | 12 | 94 |
| Diana | 3 | 65 |
Each row represents a pair of related data values for the same subject.
Multivariate data
Multivariate data extends this concept to three or more related variables. You might collect a person's age, height, and weight all together. This type of data allows for more complex analysis of how multiple factors might be connected.
For example, in a study about people's choice of holiday destination, you might collect multivariate data including the name of the destination and the temperature during the month of their holiday, alongside other factors like cost or duration of stay.
Key Points to Remember:
- Raw data is your unprocessed, original information before any organisation or analysis
- Quantitative data uses numbers and can be either continuous (any value within a range) or discrete (specific separate values only)
- Qualitative data describes categories, types, or qualities rather than amounts
- Bivariate data involves pairs of related information, whilst multivariate data involves three or more related variables
- Ordinal data is discrete data with a natural order or ranking system