Two-way tables (AQA GCSE Statistics): Revision Notes
Two-way tables
Understanding two-way tables in stratified sampling
When conducting stratified sampling, you can use each individual cell within a two-way table as a separate stratum. This approach allows you to create multiple groups based on two different characteristics simultaneously, such as age and gender.
The fundamental principle remains the same: you must ensure that the proportion of each stratum in your sample matches its proportion in the overall population. This guarantees that your sample accurately represents the population you're studying.
A stratum (plural: strata) refers to a distinct subgroup within your population. In two-way tables, each cell represents a unique stratum based on the combination of two characteristics.
Why use two-way tables for stratification
Two-way tables provide an excellent framework for stratified sampling because they naturally divide your population into distinct, non-overlapping groups. Each cell represents a unique combination of characteristics, making it easy to identify and sample from specific subgroups within your population.
This method produces a representative sample that maintains the same demographic balance as the original population, leading to more reliable and valid research results.
Worked example: Library usage investigation
Let's examine how this works in practice with a detailed example about library usage research.
The scenario
Jan is investigating the use of a local library and has population data about people who used the library in the past month. She wants to take a sample of 120 library users, stratified by age and gender.
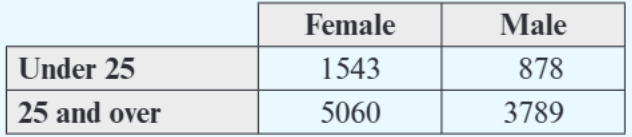
The population data shows:
- Females under 25: 1,543 people
- Males under 25: 878 people
- Females 25 and over: 5,060 people
- Males 25 and over: 3,789 people
Why stratified sampling is suitable
Stratified sampling is an excellent choice for Jan's investigation because it will produce a representative sample of the people who use the library. By maintaining the same proportions of different age and gender groups as exist in the population, her findings will be more reliable and applicable to the entire library-using community.
Calculating sample sizes step-by-step
Worked Example: Library Usage Sample Calculation
Step 1: Calculate the total population size Total population = 1,543 + 878 + 5,060 + 3,789 = 11,270 people
Step 2: Calculate the proportion for each stratum
- Proportion of under-25 females =
- Proportion of under-25 males =
- Proportion of 25+ females =
- Proportion of 25+ males =
Step 3: Calculate sample size for each stratum
For each group, multiply the proportion by the total sample size (120):
- Under-25 females: , rounded to 16
- Under-25 males: , rounded to 9
- 25+ females: , rounded to 54
- 25+ males: , rounded to 40
Step 4: Check your total and apply the golden rule Adding up the rounded numbers: 16 + 9 + 54 + 40 = 119
Since this is one short of our target sample size of 120, we need to apply the golden rule.
The golden rule for small samples
Golden Rule for Stratified Sampling
If your sample size is too small after rounding, add 1 to the largest stratum.
In our library example, the largest stratum is females aged 25 and over (54 people), so we increase this to 55.
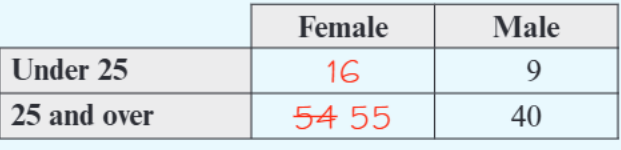
Final sample sizes:
- Under-25 females: 16
- Under-25 males: 9
- 25+ females: 55
- 25+ males: 40
- Total: 120 ✓
Step-by-step method for stratified sampling with two-way tables
Here's the complete methodology for using two-way tables in stratified sampling:
- Identify your strata - Each cell in the two-way table becomes a separate stratum
- Calculate total population - Add all values in the table
- Find proportions - Divide each stratum size by total population
- Calculate sample sizes - Multiply each proportion by desired sample size
- Round to whole numbers - You can't sample part of a person!
- Check total - Add up all rounded sample sizes
- Apply golden rule if needed - Add 1 to largest stratum if total is too small
Why This Method Works
This systematic approach ensures that your sample maintains the same proportional representation as your population. Each stratum's size in the sample directly reflects its size in the population, creating a truly representative sample.
Practice opportunity
Here's another scenario to test your understanding:
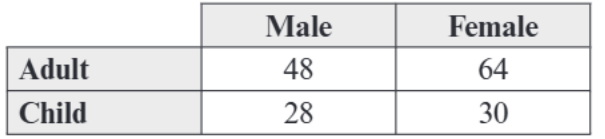
A doctor wants to take a sample of 50 patients stratified by age and gender from surgery attendees. The population shows:
- Adult males: 48 patients
- Adult females: 64 patients
- Child males: 28 patients
- Child females: 30 patients
Try calculating the sample size for each group using the method above!
Key Points to Remember:
- Each cell in a two-way table can be treated as a separate stratum for sampling
- Always maintain proportional representation between your sample and population
- Calculate proportions using:
- Round sample sizes to whole numbers and check your total adds up correctly
- Apply the golden rule: add 1 to the largest stratum if your total sample is too small
- Stratified sampling with two-way tables produces highly representative samples for research