Interpolation and extrapolation (AQA GCSE Statistics): Revision Notes
Interpolation and extrapolation
What are interpolation and extrapolation?
When working with scatter diagrams and lines of best fit, we can use them to estimate or predict values. However, there are two different types of predictions we can make, and they have different levels of reliability.
Interpolation is when you use a line of best fit to estimate values that fall within the range of your existing data. Since you're working within the bounds of your measurements, these estimates are generally reliable and trustworthy.
Extrapolation is when you use a line of best fit to predict values that fall outside the range of your existing data. These predictions extend beyond what you've actually measured, making them less reliable and more uncertain.
The key difference lies in whether your prediction uses values within your measured data range (interpolation - reliable) or outside your measured data range (extrapolation - less reliable).
The line of best fit and mean point
A crucial concept to remember is that the line of best fit always passes through the mean point of your data. This mean point is calculated by finding the average of all your x-coordinates and the average of all your y-coordinates.
Mean Point Calculation:
- Mean x-coordinate =
- Mean y-coordinate =
- Mean point = (mean x-coordinate, mean y-coordinate)
Worked example: Candle heights and lifetimes
Worked Example: Candle Heights and Lifetimes
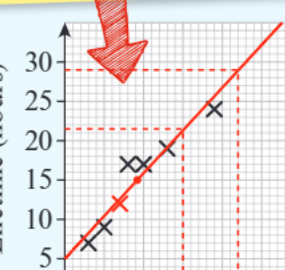
The situation: A scatter diagram shows information about the heights and lifetimes of six candles. One additional candle has an initial height of 7cm and a lifetime of 12 hours.
Step 1: Calculate the mean point
First, we need to find the mean point for all seven candles. From the data given:
- Mean height = 9cm
- Mean lifetime = 15 hours
So our mean point is .
Step 2: Draw the line of best fit
The line of best fit must pass through this mean point and follow the general trend of the data points.
Step 3: Using interpolation (reliable method)
Question: A candle has an initial height of 15cm. Estimate its lifetime.
Since 15cm falls within the range of measured heights (between the smallest and largest heights in our data), this is interpolation.
Answer: Using the line of best fit, the lifetime is 21.5 hours.
Why it's reliable: This estimate uses a value within the range of our measurements, so we can be confident in the result.
Step 4: Using extrapolation (less reliable method)
Question: Another candle has an initial height of 22cm. Predict its lifetime.
Since 22cm falls outside the range of measured heights (beyond our largest measurement), this is extrapolation.
Answer: Using the line of best fit, the lifetime is 29 hours.
Why it's less reliable: This prediction uses a value outside the range of our measurements, so we cannot be certain the same relationship continues beyond our data.
Practical application: Car depreciation
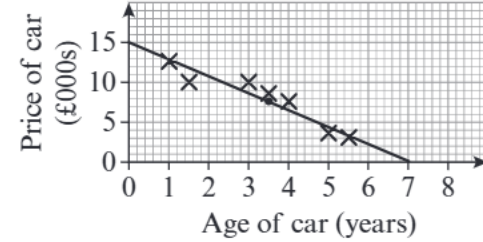
Let's consider another example involving car prices and age. The scatter diagram shows how second-hand car prices decrease as the cars get older.
Worked Example: Car Depreciation
Interpolation example
Question: A second-hand car is sold when it is two years old. Estimate its price.
Since 2 years falls within the range of ages shown in the data, this is interpolation. Looking at the line of best fit, we can estimate the price reliably.
Comment on reliability: This estimate is reliable because it uses a value within the range of the measurements.
Extrapolation example
Question: Another second-hand car is sold when it is 6.5 years old. Predict its price.
Since 6.5 years appears to fall outside or at the edge of the data range, this would be extrapolation.
Comment on reliability: This prediction is not reliable because it uses a value outside or at the edge of the range of measurements. The relationship between car age and price might change beyond the measured range.
Key differences summary
| Interpolation | Extrapolation |
|---|---|
| Estimates values within the data range | Predicts values beyond the data range |
| Reliable because it uses known patterns | Less reliable because it assumes patterns continue |
| Safer to use for decision-making | Should be used with caution |
Key Points to Remember:
- Interpolation means estimating within your data range - it's reliable because you're working with known patterns
- Extrapolation means predicting beyond your data range - it's less reliable because you're assuming patterns continue outside your measurements
- The line of best fit always passes through the mean point of your data
- When commenting on reliability, always explain whether the value falls within or outside the range of your original measurements
- Extrapolation becomes increasingly unreliable the further you move away from your data range