GDP (AQA GCSE Statistics): Revision Notes
GDP
Gross Domestic Product, commonly known as GDP, is one of the most important index numbers you'll encounter in your economics studies. Understanding how to interpret and analyse GDP data is essential for your GCSE exams.
What is GDP?
GDP represents the total value of all goods and services produced within a country during a specific time period, typically measured quarterly (every three months) or annually. Think of it as a way to measure how productive and successful an economy is at creating wealth.

When economists talk about economic output, they're referring to everything from manufactured products to services like healthcare, education, and retail. GDP captures all of this economic activity and gives us a single number to work with.
GDP can be measured over different time periods, but quarterly (every 3 months) and annual measurements are the most common. This flexibility allows economists to track both short-term fluctuations and long-term trends in economic performance.
Why GDP matters as an economic indicator
GDP serves two crucial purposes in economics. Firstly, it acts as an indicator for inflation, helping economists understand whether prices are rising too quickly in the economy. Secondly, it allows us to compare the economic performance of different countries on a level playing field.
When you see GDP figures reported in the news, they're usually presented as percentage changes from the previous period. This helps us understand whether the economy is growing, shrinking, or staying stable.
GDP figures in news reports almost always show percentage changes, not absolute values. A country with a trillion economy growing by represents much more economic activity than a country with a billion economy growing by .
Reading GDP quarterly data
Let's examine how GDP data is typically presented. The table below shows UK quarterly growth figures as percentages:
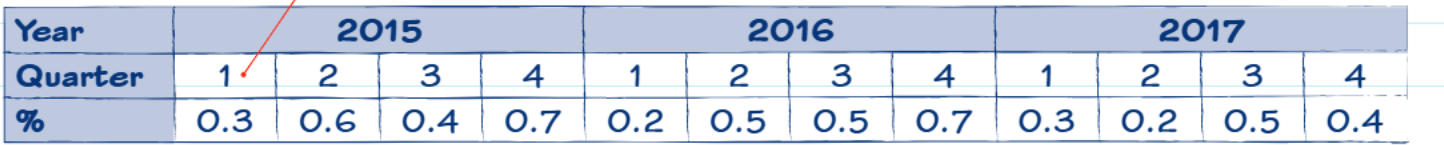
Each quarter represents a three-month period:
- Q1: January to March
- Q2: April to June
- Q3: July to September
- Q4: October to December
When you see a figure like 0.3% for Q1 2015, this means the UK economy grew by 0.3% compared to the previous quarter (Q4 2014). These might seem like small numbers, but remember that they represent the growth of an entire national economy worth trillions of pounds.
Understanding the Scale: A quarterly growth rate might seem small, but when applied to the UK's economy (worth over £2 trillion), this represents billions of pounds of additional economic activity.
Sectoral breakdown of GDP
GDP can be broken down into different sectors of the economy. This helps us understand which parts of the economy are performing well and which might be struggling.
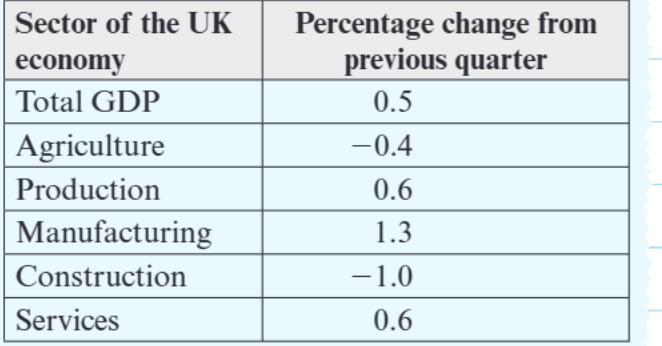
The main sectors typically include:
- Agriculture: Farming, fishing, and forestry
- Production: Mining, utilities, and basic manufacturing
- Manufacturing: Creation of finished goods from raw materials
- Construction: Building houses, offices, and infrastructure
- Services: Everything from shops and restaurants to banks and hospitals
Understanding sectoral performance is crucial because different sectors contribute different amounts to the overall economy. In the UK, services typically make up the largest portion of GDP.
Sector Size Matters: In developed economies like the UK, the services sector often represents 70-80% of total GDP, while agriculture might only account for 1-2%. This means a small percentage change in services has a much bigger impact on overall GDP than a large percentage change in agriculture.
Worked example: Interpreting sectoral changes
Worked Example: Interpreting Sectoral Data
Question: Describe the percentage change in GDP for the Agriculture sector in the last quarter of 2017.
Solution: Looking at the sectoral breakdown table, we can see that Agriculture showed a change. This means the agriculture sector decreased by 0.4% compared to the previous quarter.
The negative sign is crucial here – it indicates the sector contracted rather than grew. This is important information because it shows that while the overall economy might be growing, individual sectors can still face challenges.
Comparing GDP across countries
GDP data becomes even more powerful when we compare different countries' performance. Here's how quarterly growth might look across different nations:
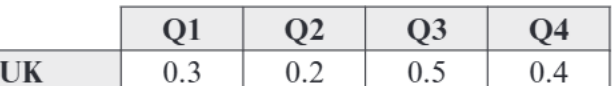
When analysing comparative data, look for patterns:
- Which country shows the most consistent growth?
- Which country has the highest individual quarterly growth?
- Are there any quarters where all countries performed similarly?
Comparative Analysis Tips: When comparing international GDP data, remember that countries at different stages of development may have different typical growth rates. Emerging economies often show higher but more volatile growth rates compared to developed economies.
Common exam traps and problem-solving tips
Trap 1: Assuming equal sector contributions
Students often assume that if two sectors have the same percentage growth, they contribute equally to overall GDP. This isn't necessarily true – a increase in Services (which might represent of the economy) has a much bigger impact than a increase in Agriculture (which might only be of the economy).
Trap 2: Misinterpreting negative growth
A negative percentage doesn't always mean disaster. Some seasonal variation is normal, and one quarter of negative growth doesn't necessarily indicate a recession.
Problem-solving approach:
- Always read the question carefully to understand what time period you're analysing
- Check whether you're looking at quarter-on-quarter or year-on-year data
- Consider the relative size of different sectors when making judgements
- Look for trends rather than focusing on single data points
Step-by-step calculation example
Worked Example: Calculating Weighted Sectoral Contributions
Question: If Services represents 80% of the economy and grows by 0.6%, while Manufacturing represents 10% and grows by 1.3%, what is the combined contribution to GDP growth?
Step 1: Calculate the weighted contribution of Services
Step 2: Calculate the weighted contribution of Manufacturing
Step 3: Add the contributions together
This shows how different sectors contribute to overall economic growth based on their size and performance.
Key Points to Remember:
- GDP measures the total value of goods and services produced in a country during a specific period
- GDP data is usually presented as quarterly percentage changes, showing growth or contraction compared to the previous period
- Different economic sectors contribute different amounts to overall GDP, so percentage changes must be considered alongside sector size
- When comparing countries, look for patterns and consistency rather than just individual high figures
- Always check whether data shows quarter-on-quarter or year-on-year changes, as this affects interpretation