Standardised rates (AQA GCSE Statistics): Revision Notes
Standardised rates
What are standardised rates?
When comparing health statistics between different populations, we often face a problem: different areas have different age structures. For example, a seaside town might have many elderly residents, whilst a university town might have mostly younger people. This makes it unfair to directly compare crude death rates between these areas.
Standardised rates solve this problem by adjusting the data to account for differences in age distribution. Think of it as creating a "level playing field" that allows fair comparisons between populations with different characteristics.
The key insight is that crude rates can be misleading when populations have different demographic compositions. Standardised rates eliminate this bias by creating comparable conditions across different populations.
Why do we need standardised rates?
Crude rates simply divide the number of events (like deaths) by the total population. However, this doesn't consider that older people are naturally more likely to die than younger people. If Town A has many elderly residents and Town B has mostly young families, Town A will appear to have a much higher death rate - even if both towns have equally good healthcare.
Standardised rates remove this bias by calculating what the death rate would be if both populations had the same age structure. This gives us a much fairer comparison.
Key formulas
There are two important calculations you need to master:
Standard population:
Standardised rate:
The key thing to remember is that you calculate the standard population first, then use this to find the standardised rate for each age group.
Worked example step-by-step
Let's work through a complete example using real data. We have a town with a total population of 45,980 people, and we want to calculate standardised death rates for different age groups.
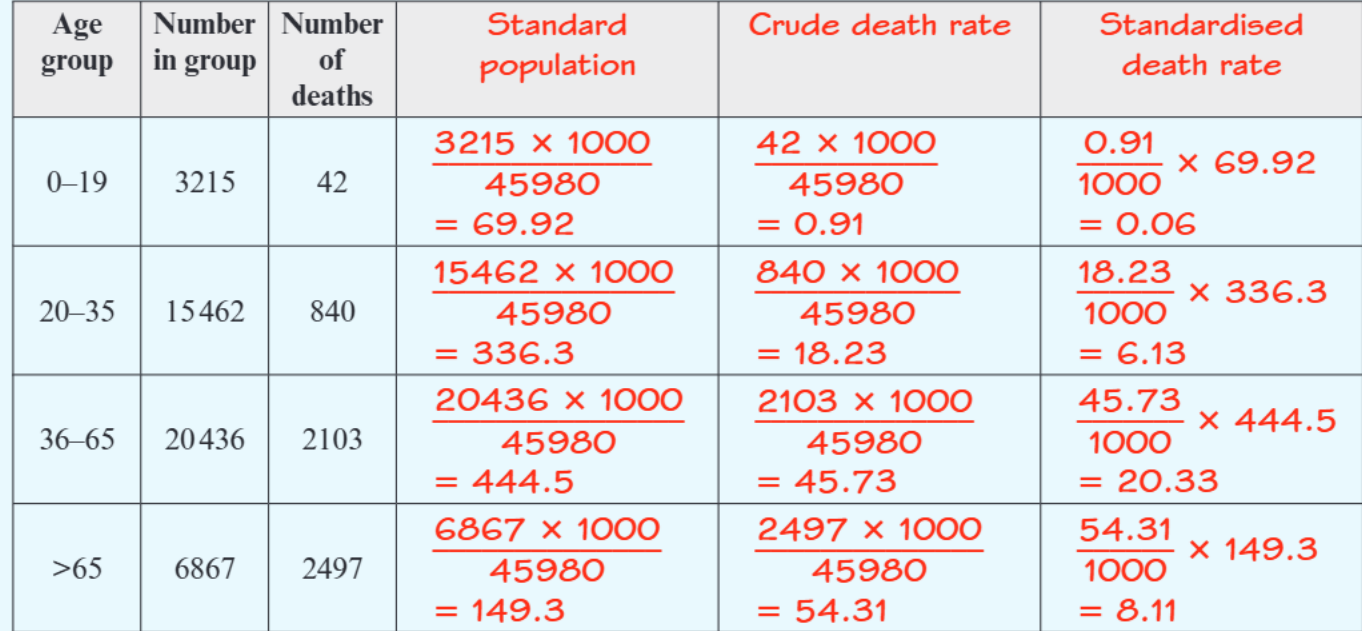
Worked Example: Calculating Standardised Death Rates
Step 1: Calculate the standard population for each age group
For the 0-19 age group:
- Number in group: 3,215
- Standard population =
For the 20-35 age group:
- Number in group: 15,462
- Standard population =
Step 2: Calculate the crude death rate for each age group
For the 0-19 age group:
- Deaths: 42
- Crude death rate =
For the 20-35 age group:
- Deaths: 840
- Crude death rate =
Step 3: Calculate the standardised death rate
For the 0-19 age group:
- Standardised rate =
For the 20-35 age group:
- Standardised rate =
The same process continues for all age groups in the table.
Interpreting standardised death rates
Looking at our worked example, we can see that:
- The 0-19 age group has the lowest standardised death rate (0.06)
- The 36-65 age group has the highest standardised death rate (20.33)
This tells us the number of deaths per 1000 people in each age group, adjusted for the population structure. The standardised rates allow us to compare the relative risk of death across different age groups fairly.
Comparing different populations
When comparing populations with different age structures, standardised rates become even more valuable.
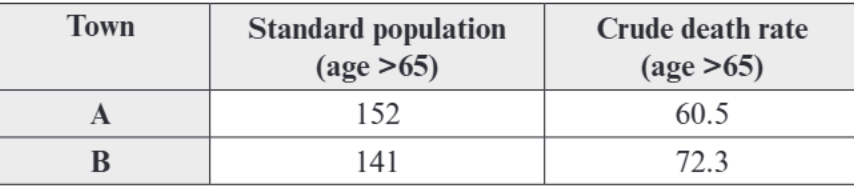
Consider two towns comparing death rates for people over 65:
- Town A: Standard population = 152, Crude death rate = 60.5
- Town B: Standard population = 141, Crude death rate = 72.3
At first glance, Town B appears to have a much higher death rate. However, when we calculate standardised rates, we need to consider both the crude rate and the population structure to make a fair comparison.
Common exam tips and traps
Exam tip 1: Always calculate standard population first, then use it to find standardised rates. Don't try to skip steps!
Exam tip 2: Remember to multiply by 1000 when calculating standard population, but divide by 1000 when calculating standardised rates.
Common trap: Don't confuse crude rates with standardised rates. Crude rates are just deaths divided by population - they don't account for age differences.
Common trap: Make sure you're using the correct total population in your calculations. Check the question carefully!
Exam tip 3: When interpreting results, always explain what the numbers mean in context. For example: "The standardised death rate of 6.13 means there are approximately 6 deaths per 1000 people in this age group."
Remember!
Key Points to Remember:
- Standardised rates allow fair comparison between populations with different age structures
- Always calculate standard population first using:
- Then calculate standardised rate using:
- Standardised rates tell you the number of events per 1000 people, adjusted for population differences
- These calculations help identify genuine differences in health outcomes rather than differences due to population age structure