Weighted index numbers (AQA GCSE Statistics): Revision Notes
Weighted index numbers
What are weighted index numbers?
Sometimes you need to measure how a collection of different items changes in value over time, but not all items are equally important. Weighted index numbers help solve this problem by giving different items different levels of importance (called "weights") in the overall calculation.
Think of it like this - if you're tracking the cost of your weekly shopping, bread might be more important than luxury chocolates because you buy bread every week. The bread would get a higher weight in your calculation.
Real-world applications of weighted index numbers are everywhere in economics and finance. The Consumer Price Index (CPI) and Retail Price Index (RPI) are examples that governments use to measure inflation by tracking how the prices of common goods and services change over time. These indices help determine economic policy and cost-of-living adjustments.

How to calculate weighted index numbers
The process involves two main steps: calculating weighted means for different time periods, then comparing them to create an index number.
Step 1: Calculate the weighted mean
The weighted mean formula is:
This can also be written as:
Where:
- represents each individual value
- represents the weight of each item
- means "sum of" (add them all up)
Step 2: Calculate the index number
Once you have weighted means for different years, you can calculate the index number using:
Critical Point: The base year always has an index of exactly 100. This serves as your reference point - any index above 100 indicates an increase, while below 100 indicates a decrease from the base year.
Worked example: Share prices
Let's work through a complete example to see how this works in practice.
Worked Example: Calculating Weighted Index Numbers for Share Prices
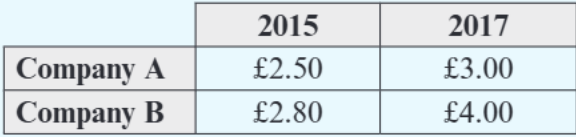
Shona owns shares in two companies. In 2015, she had 1000 shares in Company A and 2500 shares in Company B. She still owns the same amounts in 2017. Here are the share prices:
- Company A: £2.50 (2015) → £3.00 (2017)
- Company B: £2.80 (2015) → £4.00 (2017)
The weights are 1000 for Company A and 2500 for Company B (based on the number of shares owned).
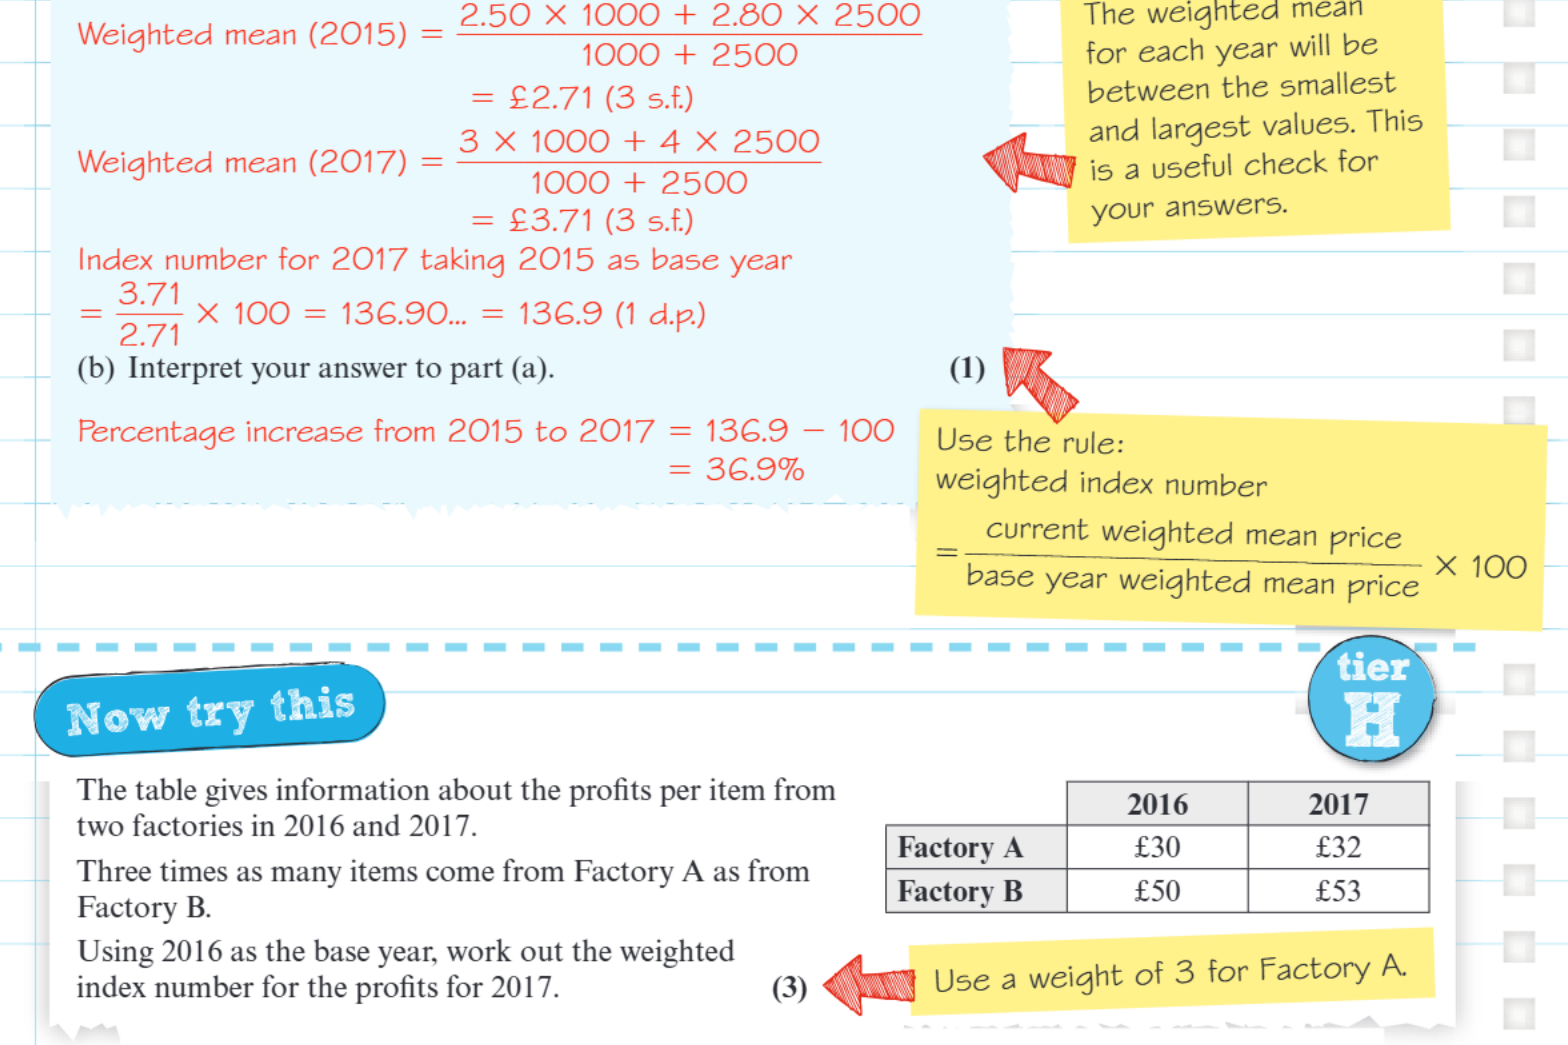
Step 1: Calculate the weighted mean for 2015
Step 2: Calculate the weighted mean for 2017
Step 3: Calculate the index number
Interpreting the result:
The index number of 136.9 means the weighted average share price has increased by 36.9% from 2015 to 2017.
To find the percentage increase: 136.9 - 100 = 36.9%
Important tips for success
Check your weighted means: The weighted mean should always fall between the smallest and largest values in your data set. If it doesn't, you've made a calculation error and need to recalculate.
Remember the base year: The base year always has an index of 100. Any year with an index above 100 shows an increase, while below 100 shows a decrease from the base year.
Show your working: Always write out each step clearly in exams. This includes showing how you multiply each value by its weight, then divide by the total of all weights. Examiners award marks for method even if your final answer is incorrect.
Understand what weights represent: Weights show the relative importance of each item. Higher weights mean that item has more influence on the final result. In our example, Company B had more influence because Shona owned more shares.
Key Points to Remember:
- Weighted index numbers measure changes in a collection of items where each item has different importance
- The calculation involves two steps: calculating weighted means for different time periods, then comparing them
- Weights represent the relative importance of each item in the calculation
- The base year always equals 100, so results above 100 show increases and below 100 show decreases
- Always check that your weighted mean falls between the highest and lowest individual values
- To find percentage change, subtract 100 from your final index number