Quality control (AQA GCSE Statistics): Revision Notes
Quality control
What is quality control?
Quality control is essential when items are manufactured on a production line. Companies need to regularly check that their products meet the required standards rather than testing every single item, which would be impractical and expensive.
The most effective method involves taking a sample of items periodically and testing these items by measuring key characteristics such as weight, length, or volume. This sampling approach allows manufacturers to monitor quality without disrupting the entire production process.
Control charts and sample means
A quality control tester calculates the sample mean of the measurements from each sample and plots this value on a quality control chart. This creates a visual representation of how the production process is performing over time.
Each sample will produce a different mean value, but if the process is working correctly, these sample means should follow a normal distribution around a target value. The target value is represented by the symbol (mu), which is the expected mean for the process.
How control charts work
Control charts use the properties of normal distribution to set boundaries that help determine when action is needed. Understanding these boundaries is crucial for effective quality monitoring.
The chart shows:
- Target mean (): The ideal average value for the process
- Warning limits: Set at from the target mean
- Action limits: Set at from the target mean
The Greek letter (sigma) represents the standard deviation, which measures how spread out the data is around the mean.
Warning and action limits explained
Understanding these limits is crucial for effective quality control and knowing when to take action.
Warning limits (): When everything is working correctly, approximately 95% of sample means should fall within these limits. This means that in 19 out of every 20 samples, the sample mean should lie between the warning limits.
Action limits (): These represent the outer boundaries where 99.7% of sample means should fall when the process is working properly. This means that 998 out of every 1000 samples should have means within these limits.
If a sample mean falls outside these limits, there's only a 0.2% probability that this happened by chance, strongly suggesting something has gone wrong with the process.
Actions to ensure quality control
There's a clear three-step system for responding to sample results:
Quality Control Action System:
Action 1 - No action needed: When the sample mean falls within the warning limits, the process is working normally. Continue production without any intervention.
Action 2 - Test again: If the sample mean falls between the warning limit and the action limit, this serves as an early warning. Take another sample immediately to check if this was just a random variation or indicates a developing problem.
Action 3 - Stop and reset: When the sample mean falls outside the action limit, stop the machine immediately. Check what's gone wrong and reset the process before continuing production.
Worked example walkthrough
Worked Example: Precision Needle Manufacturing
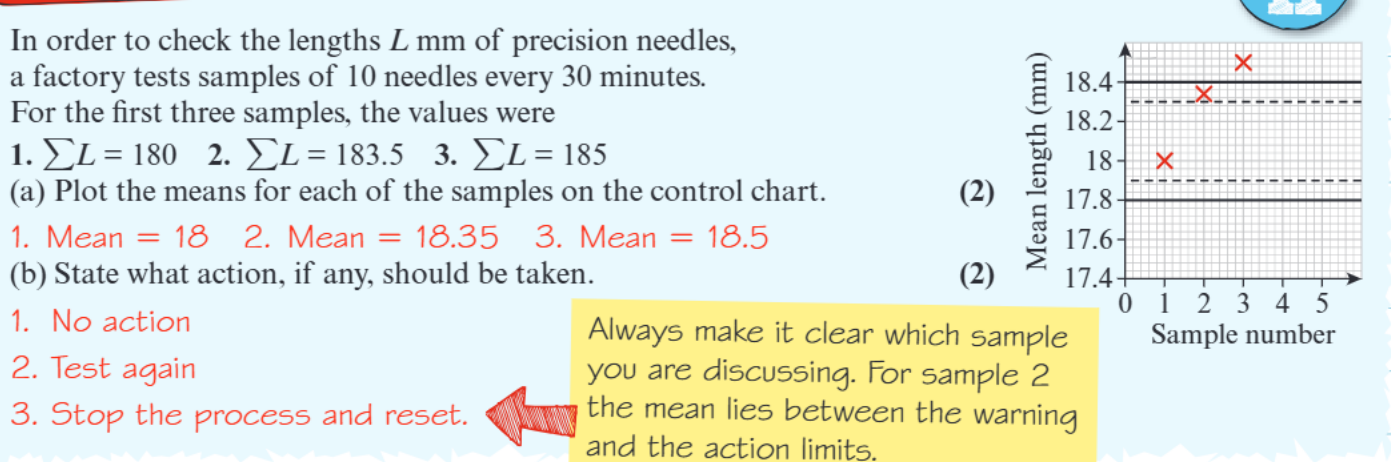
The situation: A factory tests needle lengths by sampling 10 needles every 30 minutes. For the first three samples, the total lengths were:
- Sample 1:
- Sample 2:
- Sample 3:
Calculating sample means:
- Sample 1 mean =
- Sample 2 mean =
- Sample 3 mean =
Interpreting the results: Looking at the control chart, we can see that sample 2 has a mean that lies between the warning and action limits. According to our three-step system, this means we should test again to determine if this is just natural variation or indicates a problem developing.
Key exam tip: Always clearly state which sample you're discussing and explain your reasoning. For example, "Sample 2 the mean lies between the warning and action limits, therefore we should test again."
Remember!
Key Points to Remember:
- Quality control uses sampling rather than testing every item to monitor production efficiently
- Control charts plot sample means to visualise how the process is performing over time
- Warning limits () contain 95% of sample means when the process works correctly
- Action limits () contain 99.7% of sample means under normal conditions
- Three-action system: No action (within warning limits), test again (between warning and action), stop and reset (outside action limits)