Stem and leaf diagrams (AQA GCSE Statistics): Revision Notes
Stem and leaf diagrams
What are stem and leaf diagrams?
Stem and leaf diagrams are a brilliant way to organise and display discrete numerical data whilst showing the actual data values. Unlike other charts that might group data together, stem and leaf diagrams let you see every individual piece of data while still showing the overall pattern or distribution.
Think of them as a way to arrange numbers so you can quickly spot trends, find the most common values, and see how spread out your data is.
The key advantage of stem and leaf diagrams over other types of charts is that they preserve all original data values while still revealing patterns and distributions in the dataset.
Understanding the structure
The structure of a stem and leaf diagram is quite straightforward once you understand the basics:
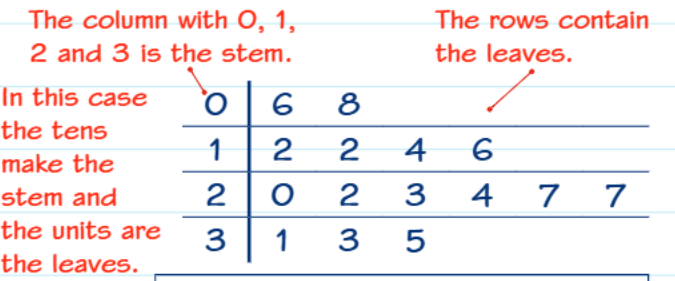
The stem represents the tens digit (or higher place values) of your numbers. This forms the left column of your diagram.
The leaves represent the units digit of your numbers. These are arranged horizontally in rows next to their corresponding stem. Crucially, leaves must always be single digits.
The key tells you how to interpret the diagram. For example, if your key shows "3|5 represents 35", this means a stem of 3 with a leaf of 5 equals the value 35.
Creating an ordered stem and leaf diagram step-by-step
Let's work through creating a proper ordered stem and leaf diagram using a practical example.

Here's the raw data we'll work with - the number of goals a player scored in different games.
Worked Example: Creating an Ordered Stem and Leaf Diagram
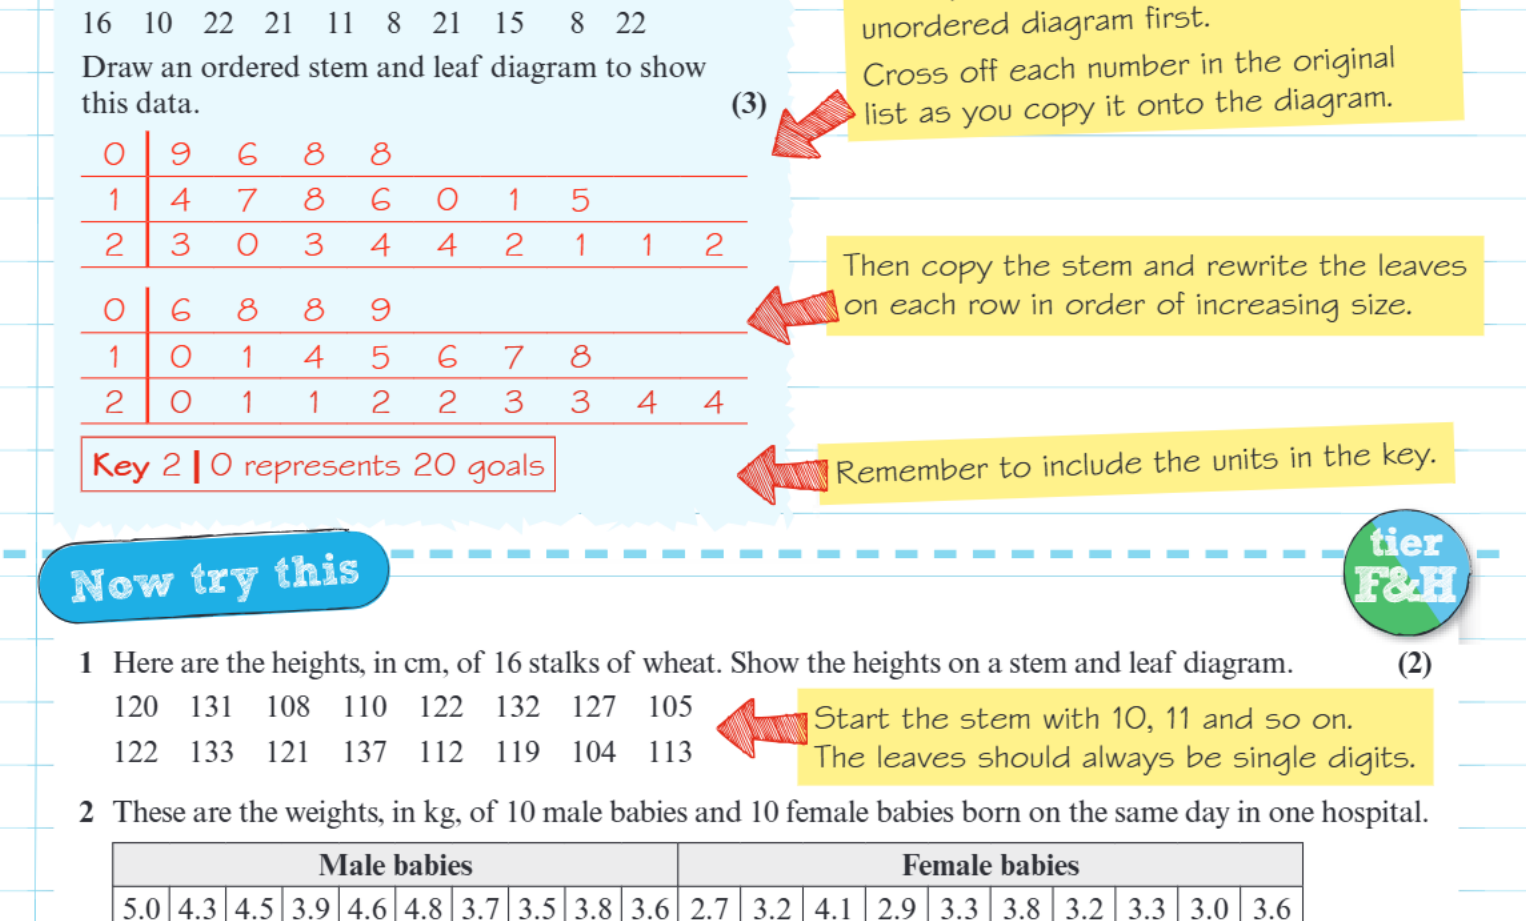
Step 1: Set up your stems First, look at your data and identify the range. Create stems that cover all your values. For our goal data, we need stems 0, 1, and 2 to cover values from 6 to 24.
Step 2: Create an unordered diagram first Go through your original data list and place each number in the correct row. As you do this, cross off each number from your original list to avoid missing any or counting twice.
For example:
- 23 goes in row 2 with leaf 3
- 9 goes in row 0 with leaf 9
- 20 goes in row 2 with leaf 0
Step 3: Rewrite with leaves in ascending order This is the crucial step that makes your diagram "ordered". Go through each row and rearrange the leaves so they're in increasing order from left to right.
Step 4: Include your key Always include a key that clearly shows how to read your diagram. This prevents any confusion about what the numbers represent.
Back-to-back stem and leaf diagrams
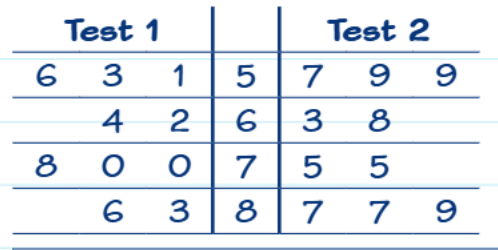
Back-to-back diagrams are particularly useful when you want to compare two sets of data that have similar ranges. They work by sharing the same stem column in the middle, with leaves extending to the left for one dataset and to the right for the other.
In a back-to-back diagram, you typically arrange the leaves so that the smallest values in each row are closest to the central stem. This makes it easier to compare the distributions visually.
The beauty of back-to-back diagrams is that you can quickly see:
- Which group tends to have higher or lower values
- How spread out each group's data is
- Whether the distributions have similar shapes
When creating the key for back-to-back diagrams, you often need two parts to explain both sides clearly.
Important rules to remember
Critical Rules for Stem and Leaf Diagrams:
Leaves must always be single digits: This is absolutely essential. If you have a number like 156, the stem would be 15 and the leaf would be 6. You cannot have leaves that are two or more digits.
Order matters: In a properly constructed stem and leaf diagram, the leaves should be arranged in ascending order within each row. This makes it much easier to read and analyse the data.
Don't forget the key: Your diagram is meaningless without a proper key. Always include one that clearly explains how to interpret the stem and leaf combination.
Cross off as you go: When transferring data from your original list to the diagram, cross off each number as you use it. This prevents errors and ensures you don't miss any data points.
Reading and interpreting diagrams
When you're given a stem and leaf diagram to interpret, start by understanding the key. Then you can read off individual values and look for patterns:
- Modal values: Look for leaves that appear most frequently
- Range: Find the difference between the highest and lowest values
- Distribution shape: See if the data clusters around certain values or spreads evenly
The great advantage of stem and leaf diagrams over other types of charts is that you retain all the original data values while still seeing the overall pattern.
Key Points to Remember:
- Stems represent the tens digits, leaves represent the units digits
- Leaves must always be single digits - this is non-negotiable
- Always arrange leaves in ascending order within each row for a proper ordered diagram
- Include a clear key showing how to interpret stem|leaf combinations
- Back-to-back diagrams are excellent for comparing two similar datasets