Two-way tables (AQA GCSE Statistics): Revision Notes
Two-way tables
What is a two-way table?
A two-way table is a useful way to organise and display information about two different categories or variables at the same time. When we have data that involves two variables, we call this bivariate data. These tables help us see patterns and relationships between the two categories we're studying.
Two-way tables are particularly powerful because they allow us to examine relationships between variables that might not be obvious when looking at each variable separately.
For example, we might want to examine how age affects food preferences, or whether gender influences choice of musical instrument. Two-way tables make these comparisons clear and easy to analyse.
Understanding the structure
Two-way tables are organised in a grid format with:
- Rows representing one category (like age groups: Adult/Child)
- Columns representing another category (like preferences: With custard/With cream)
- Cells containing the frequency or count for each combination
- Totals for each row and column, plus a grand total
Let's look at an example showing dessert preferences:
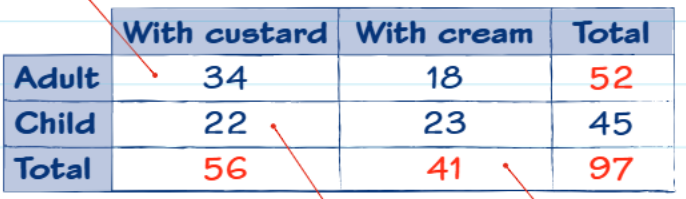
In this table:
- 34 adults preferred custard, 18 preferred cream (total: 52 adults)
- 22 children preferred custard, 23 preferred cream (total: 45 children)
- Overall: 56 people chose custard, 41 chose cream (grand total: 97 people)
The figures shown in blue are the actual survey responses, while the red figures are calculated totals. This distinction helps you understand which numbers are raw data and which are derived calculations.
Completing a two-way table
Often in exams, you'll need to fill in missing values in a two-way table. The key is to use addition and subtraction with the given totals.
Systematic approach for completing tables:
- Look for rows or columns with only one missing value
- Use the total to work out the missing number
- Check your work by ensuring all totals add up correctly
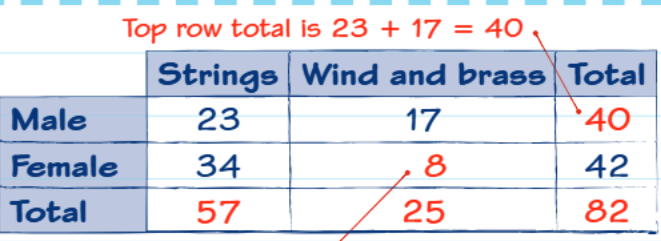
In this example about musicians:
- We know there are 40 male musicians total, with 23 playing strings
- So males playing wind/brass =
- We know there are 42 female musicians total, with 34 playing strings
- So females playing wind/brass =
Worked example: Step-by-step solution
Worked Example: Completing a News Source Survey Table
Question: A group of 53 students were asked about their main source of news - TV or internet. There were 32 boys and 21 girls in the group. Of the 31 students who said TV, 18 were boys.
Step 1: Set up the table structure Start with what you know for certain. Put in the totals first:
| TV | Internet | Total | |
|---|---|---|---|
| Boys | 32 | ||
| Girls | 21 | ||
| Total | 31 | 22 | 53 |
Step 2: Fill in the given information We know 18 boys said TV:
| TV | Internet | Total | |
|---|---|---|---|
| Boys | 18 | 32 | |
| Girls | 21 | ||
| Total | 31 | 22 | 53 |
Step 3: Calculate missing values
- Boys using internet =
- Girls using TV =
- Girls using internet =
Step 4: Complete the table and check
| TV | Internet | Total | |
|---|---|---|---|
| Boys | 18 | 14 | 32 |
| Girls | 13 | 8 | 21 |
| Total | 31 | 22 | 53 |
Step 5: Answer the question The question asks: "What was the students' main source of news?" From the table, 9 more students used TV (31) than internet (22) as their main source of news.
Key exam tips
- Always start with the information you're given - don't try to guess missing values
- Look for single gaps - rows or columns with only one missing number are easiest to complete first
- Double-check your totals - rows should add up to row totals, columns to column totals
- Give context in your answers - don't just state numbers, explain what they mean
- Show your working - even simple calculations can earn method marks
Common Exam Traps to Avoid:
- Forgetting to check that all your totals add up correctly
- Mixing up rows and columns when reading the table
- Not giving your final answer in context of the original question
- Rushing and making arithmetic errors with simple addition/subtraction
Key Points to Remember:
- Two-way tables show the relationship between two different variables or categories
- Missing values can be found using addition and subtraction with the given totals
- Always work systematically - fill in what you know first, then tackle single gaps
- Check your work by ensuring all row totals, column totals, and the grand total are consistent
- Give your final answers in context, explaining what the numbers actually mean in the real-world situation