Resource management (Edexcel GCSE Geography A): Revision Notes
Global usage and consumption
Introduction to resource consumption patterns
Food, energy and water are essential resources for human survival, but these vital resources are not distributed or consumed equally across the world. Understanding these patterns helps us recognise the significant inequalities that exist between different countries and regions.
The way people consume resources varies dramatically depending on their country's level of development, economic situation, and geographical location. This creates a complex global picture where some nations use far more resources per person than others.
Resource consumption patterns are directly linked to a country's economic development, infrastructure, and geographical advantages. These patterns help geographers understand global inequalities and development challenges.
Understanding global resource consumption differences
Energy usage patterns
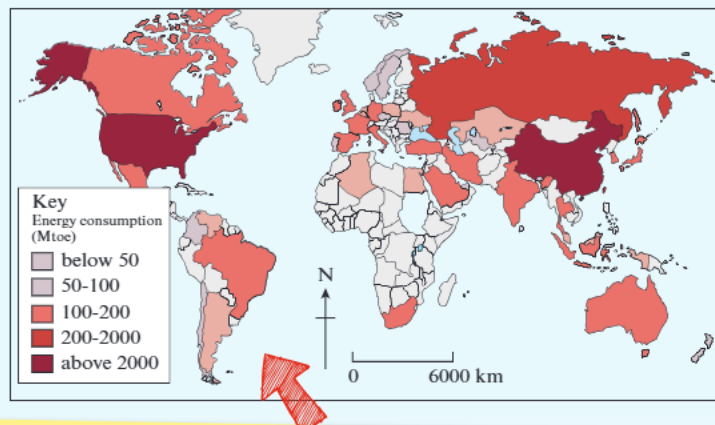
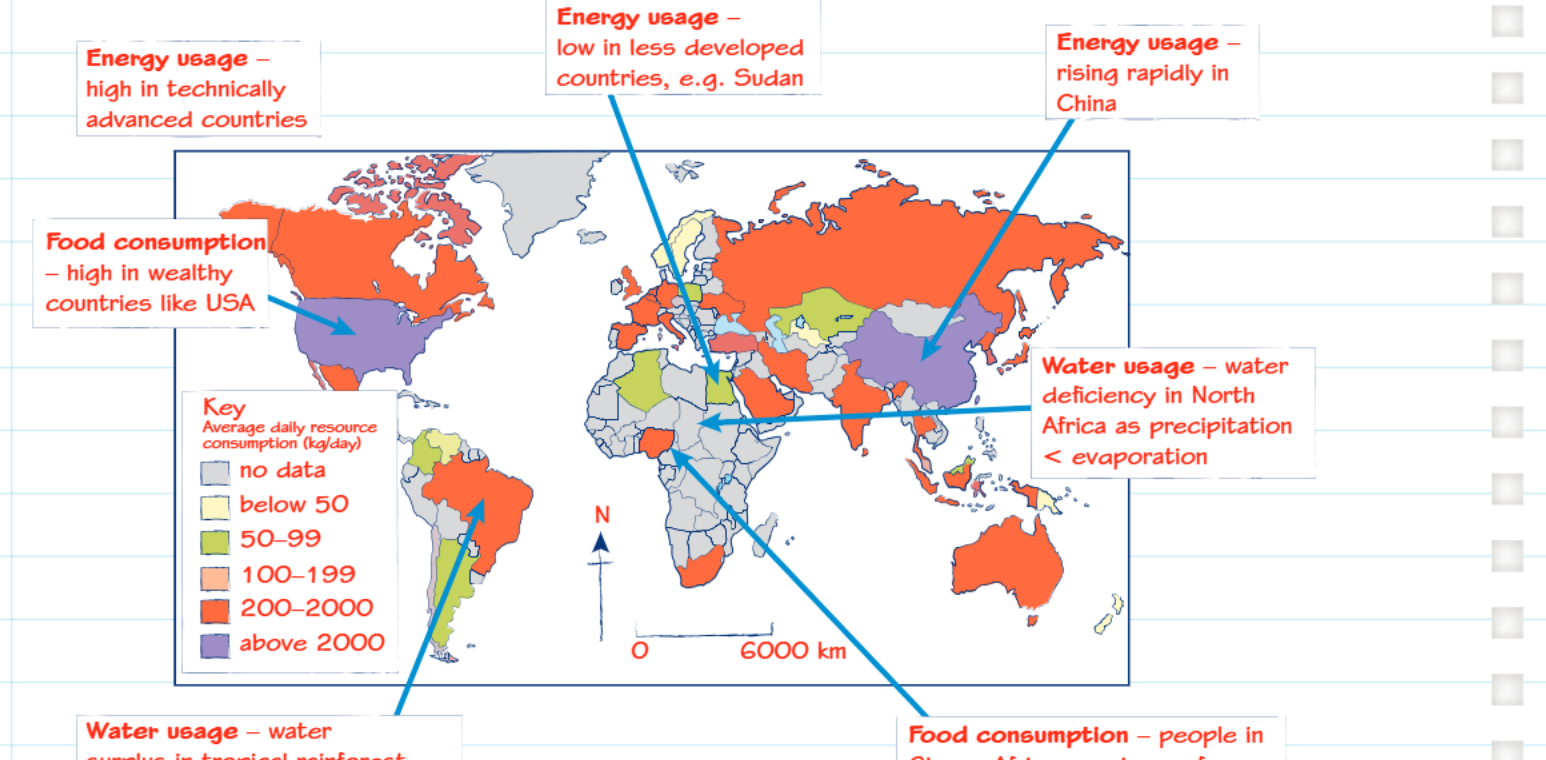
Energy consumption shows some of the clearest patterns of global inequality. Technically advanced countries like the United States consume enormous amounts of energy to power their industries, transport systems, and modern lifestyles. These wealthy nations have built their economies around high energy use, from air conditioning and heating systems to manufacturing processes and transportation networks.
In contrast, less developed countries such as Sudan have much lower energy consumption levels. This reflects limited industrial development, fewer vehicles, less electricity infrastructure, and generally lower living standards. However, the global picture is changing rapidly as emerging economies grow.
Countries like China represent a third category - nations experiencing rapid industrial development. As China has modernised its economy and improved living standards for its population, energy usage has risen dramatically. This pattern is being repeated across many developing nations as they industrialise.
Energy Consumption Example: Three Development Levels
- USA (Advanced): High energy consumption for industry, transport, and modern lifestyles
- China (Emerging): Rapidly increasing energy use due to industrialisation and urbanisation
- Sudan (Developing): Low energy consumption reflecting limited infrastructure and industry
Food consumption variations
Food consumption patterns also reveal stark global inequalities. Wealthy countries like the USA have high levels of food consumption, with citizens having access to diverse, abundant food supplies. People in these nations typically consume far more calories than needed and have access to processed foods, meat, and imported products year-round.
However, in many parts of Africa and other developing regions, food consumption is much more limited. For example, people in Ghana often survive on fewer than 2000 calories per day, which is below recommended daily requirements. This reflects issues with food security, poverty, agricultural productivity, and distribution systems.
The recommended daily calorie intake for adults is approximately 2000-2500 calories per day. Many people in developing regions consume well below this level, leading to malnutrition and health problems.
Water usage and availability
Water consumption and availability create another layer of global inequality. The distribution of water resources depends heavily on climate patterns and geographical factors, but consumption also varies based on development levels and lifestyle.
North Africa experiences water deficiency because precipitation levels are much lower than evaporation rates in these arid regions. This creates chronic water shortages that affect agriculture, industry, and daily life for millions of people.
In contrast, tropical rainforest regions often have water surplus, where precipitation exceeds evaporation. Countries in these areas may have abundant freshwater resources, though they may still face challenges in accessing and distributing clean water to their populations.
Measuring and mapping resource consumption
Understanding choropleth maps
Geographers use choropleth maps to display resource consumption data clearly and effectively. These maps use different colours or shading patterns to represent statistical information across different countries or regions. Each colour represents a specific range of values, making it easy to identify patterns and compare different areas.
Choropleth Map Definition
A choropleth map is a type of thematic map that uses colours or shading to represent statistical data across geographical areas. The key or legend is essential for interpreting what each colour represents.
When interpreting these maps, you need to carefully examine the key or legend to understand what each colour represents. The data ranges help you categorise countries into different consumption levels and identify which regions have the highest and lowest resource usage.
Key consumption statistics
The global inequality in resource consumption is highlighted by some striking statistics. The average daily consumption of resources reaches 90 kilogrammes per person in North America, demonstrating the resource-intensive lifestyles of wealthy nations. This includes everything from food and water to the materials needed for housing, transport, and consumer goods.
In stark contrast, people in Africa consume an average of only 10 kilogrammes of resources per day. This nine-fold difference illustrates the enormous gap between developed and developing nations in terms of resource access and consumption patterns.
The 90kg vs 10kg daily consumption statistic represents one of the most striking examples of global inequality. This includes all resources - food, water, materials for housing, transport, and consumer goods.
Regional examples and case studies
Different regions demonstrate various patterns of resource consumption that reflect their development status, geography, and economic conditions.
Case Study: United States - High Consumption Pattern
The United States exemplifies high-consumption developed nations, with extensive energy use for:
- Industry and manufacturing processes
- Transport systems and high car ownership
- Domestic purposes (heating, cooling, appliances)
- Resource-intensive lifestyles with large homes and consumer goods
Case Study: China - Rapidly Changing Consumption
China represents the rapidly changing category of emerging economies:
- Dramatic growth in energy consumption due to industrialisation
- Urbanisation creating new resource demands
- Improving living standards for over a billion people
- Demonstrates direct link between development and resource consumption
Case Study: Sudan - Low Consumption Pattern
Sudan and other least developed countries show the opposite pattern:
- Low resource consumption reflecting limited economic development
- Insufficient infrastructure and access to modern amenities
- Smaller environmental footprint per person
- Challenges with poverty and meeting basic needs
Global implications and patterns
These consumption patterns create significant global challenges. Developed nations consume a disproportionate share of the world's resources despite having smaller populations, whilst developing nations often struggle to meet basic needs. As more countries develop economically, global resource consumption continues to rise, creating sustainability challenges.
The uneven distribution also affects international relations, trade patterns, and environmental impacts. Countries with high consumption levels often import resources from developing nations, creating complex global supply chains and dependencies.
Global Resource Challenge
As developing countries continue to industrialise and improve living standards, global resource consumption is expected to increase significantly. This creates challenges for sustainability and environmental protection while also highlighting the need to address global inequalities.
Key Points to Remember:
- Resource consumption varies dramatically between developed and developing countries, with wealthy nations using up to 9 times more resources per person
- Energy usage is highest in technically advanced countries but rising rapidly in emerging economies like China
- Food consumption inequalities mean some people consume excess calories whilst others survive on inadequate daily nutrition below 2000 calories
- Water availability depends on climate patterns, with deficits in arid regions and surpluses in tropical areas
- Choropleth maps use colour coding to display statistical data and help identify global consumption patterns
- The 90kg vs 10kg daily consumption difference between North America and Africa illustrates extreme global inequality