Fieldwork: Coasts (Edexcel GCSE Geography A): Revision Notes
Working with data
Understanding how to handle and display coastal fieldwork data is essential for geographical investigations. This involves processing and presenting your findings, analysing patterns, and drawing evidence-based conclusions from your research.
Common data presentation challenges
When working with coastal fieldwork data, you need to select appropriate methods for displaying your findings. However, each presentation method has specific limitations that can affect how effectively your data communicates your results.

Scattergraphs work well for displaying relationships between two variables, but they become inappropriate when you need to show connections between more than two different factors.

Pie charts can be problematic when you have numerous small segments, as these become difficult to interpret and compare accurately.

Choropleth maps may conceal important variations within specific areas by presenting uniform colouring, and they create sharp artificial boundaries rather than showing the gradual transitions that often occur in nature.
Choropleth maps are particularly problematic in coastal studies because they can mask the complex, gradual transitions that characterise most coastal environments.

Triangular graphs have a major restriction as they can only display data that has been converted into percentages.

Bar graphs are limited because they cannot effectively demonstrate relationships or connections between different categories of data.

Cross-sectional diagrams only capture a snapshot of coastal conditions at one specific moment in time, missing temporal changes.
Understanding these limitations helps you avoid common mistakes in data presentation and ensures your chosen method effectively communicates your findings to your audience.
Understanding appropriate data presentation methods
Selecting the right presentation method depends on understanding the nature of your data. For coastal fieldwork, you often collect survey data involving categories, which represents discrete data. This type of information differs from continuous data, where measurements can take any value within a range.
When time forms one of your variables, line graphs become particularly suitable for presenting continuous data. However, if your coastal fieldwork involves categorising different features or characteristics, you're working with discrete data that may be better suited to alternative presentation methods like scattergraphs.
Data Types in Coastal Fieldwork:
- Discrete data: Categories and classifications (e.g., rock types, vegetation zones)
- Continuous data: Measurements that can take any value (e.g., temperature, wave height)
Systematic data analysis approach
Successful analysis of coastal fieldwork data follows a structured approach that helps you extract meaningful insights from your collected information. This systematic method ensures you don't miss important patterns and helps build a convincing argument based on your evidence.
Begin by describing what you observe in your data. Look for overall patterns and main features that stand out. Consider whether any figures group together or if there are notable anomalies or exceptions that don't follow the general trend. This descriptive phase forms the foundation of your analysis and should be completed before moving to explanations.
Use specific evidence from your data to support your analysis. Include precise figures and measurements rather than vague generalisations, as this strengthens the credibility of your findings. Quantitative evidence provides the backbone for any geographical investigation and demonstrates rigorous fieldwork practice.
Always quote specific figures and measurements rather than using vague terms like "most" or "many" - this demonstrates analytical precision and strengthens your argument.
Provide explanations for the patterns you identify in your data. Think about the underlying processes or factors that might be causing these trends to occur. This step requires you to apply your geographical knowledge to interpret what your data is revealing about coastal processes.
Connect your findings to established geographical concepts and theories that you've studied. This demonstrates your understanding of how your specific research fits into broader geographical knowledge and shows sophisticated analytical thinking.
Drawing meaningful conclusions
Your conclusion should return to the original research question or hypothesis that guided your investigation. Use the evidence gathered through your fieldwork to provide a clear answer, demonstrating how your data supports or challenges your initial predictions.

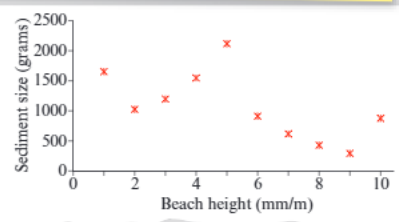
Worked Example: Interpreting Scatter Graph Data
This scatter graph demonstrates the relationship between beach height and sediment size across different coastal locations.
Step 1 - Description: The data shows a negative correlation, where higher beach elevations generally correspond to smaller sediment particles, while lower areas contain larger sediment sizes.
Step 2 - Evidence: The correlation coefficient shows a strong negative relationship (r = -0.78), with sediment sizes ranging from 2mm at 0.5m elevation to 0.2mm at 3.5m elevation.
Step 3 - Explanation: This pattern occurs because wave energy decreases with height above sea level, allowing finer materials to settle in calmer, higher areas while coarser materials remain in high-energy zones near the water.
Step 4 - Theory Connection: This demonstrates the principle of selective transportation and deposition in coastal environments.
Assessment and evaluation skills
In examinations, you may need to demonstrate critical thinking about your investigation through assessment and evaluation tasks. These skills represent higher-order thinking that goes beyond simply describing your methods and results.
Assessment vs Evaluation - Critical Differences
Assessment requires you to consider all relevant factors in your study and identify which ones had the most significant impact on your results. This involves weighing up different influences and determining their relative importance.
Evaluation involves making judgements about the value or success of your investigation methods and findings. You need to consider strengths and limitations, then reach reasoned conclusions about the overall effectiveness of your approach.
These skills help you reflect critically on your fieldwork experience and demonstrate sophisticated geographical thinking beyond simply collecting and presenting data. Developing these analytical capabilities is essential for higher-level geographical study and demonstrates your ability to think like a professional geographer.
Key Points to Remember:
-
Choose data presentation methods that match your data type - discrete data from coastal surveys needs different treatment than continuous measurements
-
Follow a systematic analysis approach: describe patterns, use specific evidence, explain reasons, and link to geographical theory
-
Your conclusions must return to your original research question and use fieldwork evidence to support your answer
-
Assessment means identifying the most important factors, while evaluation means judging the overall success and value of your investigation
-
Different presentation methods have specific limitations - understanding these helps you make better choices for displaying your coastal fieldwork results