Food Security in Tanzania (OCR GCSE Geography B (Geography for Enquiring Minds)): Revision Notes
Food Security in Tanzania
Introduction to Tanzania
Tanzania is classified as a Lower Income Developing Country (LIDC) located in East Africa. The country has a population of approximately 51 million people, with the majority living in rural areas rather than urban centres.
Understanding Tanzania's food security situation is important because it shows how countries can make progress in some areas while still facing serious challenges in others. This case study demonstrates that development is rarely straightforward or uniform across all indicators.
The Global Hunger Index (GHI)
The Global Hunger Index is a tool used to measure and track hunger levels globally. Countries are scored and ranked, with lower scores indicating better food security. The GHI takes into account several factors including undernourishment levels and child health indicators.
In 2015, Tanzania received a GHI score of 28.7, which placed the country at position 89 out of 116 countries measured. This score gave Tanzania a hunger classification of 'serious', indicating significant food security challenges.
Progress in reducing hunger
Despite the serious classification, Tanzania has made notable improvements over time. Between 1990 and 2015, the country's GHI score improved significantly, falling from 42.2 to 28.7. This represents a substantial reduction and shows positive progress in tackling hunger.
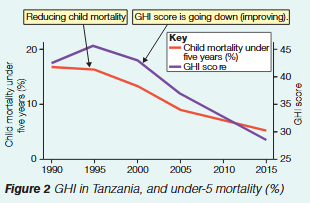
Understanding the Graph Trends
The graph demonstrates two important trends:
- Child mortality rates for children under five years old have declined steadily from around 20% in 1990 to approximately 5% by 2015
- The overall GHI score has followed a downward trend, which is a positive development as lower scores indicate better conditions
The undernourishment challenge
However, Tanzania faces a contradictory situation. While the GHI score has improved, the percentage of people who are undernourished has actually increased since 1990.
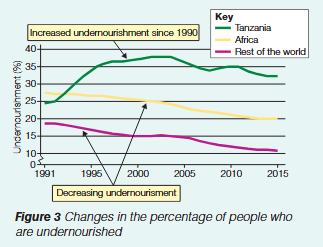
A Concerning Paradox
The data reveals that undernourishment in Tanzania rose from 24.2% in 1990 to a peak of around 36.8% in 2000, before declining slightly to 32.1% by 2015. This means that in 2015, roughly one in three Tanzanians were undernourished, which is higher than the 1990 figure of approximately one in four.
This trend is particularly concerning when compared to other regions. While Tanzania experienced rising undernourishment, both Africa as a whole and the rest of the world saw decreasing levels of undernourishment during the same period.
Understanding the statistics
The improvement in Tanzania's GHI score despite worsening undernourishment can be explained by examining the different components that make up the index.
| Year | Undernourished population (%) | Wasting in children under 5 (%) | Stunting in children under 5 (%) | Under 5 mortality rate (%) | GHI score |
|---|---|---|---|---|---|
| 1990 | 24.2 | 7.9 | 49.7 | 16.7 | 42.2 |
| 2000 | 36.8 | 5.6 | 48.3 | 13.2 | 42.5 |
| 2015 | 32.1 | 3.8 | 34.7 | 5.2 | 28.7 |
The table shows that while undernourishment increased, three important child health indicators improved dramatically:
Breaking Down the Child Health Improvements
Child mortality fell from 16.7% in 1990 to just 5.2% in 2015. This represents a reduction of more than two-thirds, meaning far fewer children were dying before their fifth birthday.
Stunting decreased from 49.7% to 34.7%. Stunting occurs when children do not grow to their full height potential due to poor nutrition over time. Although still affecting over one-third of children, this represents significant progress.
Wasting declined from 7.9% to 3.8%. Wasting refers to children who are dangerously thin for their height, usually due to recent rapid weight loss or failure to gain weight.
These improvements in child health indicators had a stronger influence on the GHI score than the worsening undernourishment situation. This means Tanzania's overall GHI score improved primarily because children's health improved, rather than because more food became available to the general population.
Why Indicators Can Tell Different Stories
When answering questions about food security statistics, always look at all the indicators, not just one measure. Countries can show improvement in some areas while struggling in others. Be prepared to explain why overall scores might improve even when individual indicators worsen. Use specific data from the statistics to support your explanations.
Key Points to Remember
- Tanzania is an East African LIDC with 51 million people, mostly in rural areas
- The country's GHI score improved from 42.2 (1990) to 28.7 (2015), but it still has a 'serious' hunger rating
- Undernourishment paradoxically worsened from 24.2% to 32.1% between 1990 and 2015, while Africa and the world improved
- Child health indicators showed major improvements:
- Under-5 mortality fell from 16.7% to 5.2%
- Stunting decreased from 49.7% to 34.7%
- Wasting declined from 7.9% to 3.8%
- The GHI improvement was driven by better child health rather than improved food availability, highlighting that food security involves multiple factors