Straight line graphs (OCR GCSE Maths): Revision Notes
Straight line graphs
Understanding Straight Line Graphs
Straight line graphs are a fundamental concept in algebra, representing linear relationships between variables. You need to learn how to recognise and draw horizontal and vertical lines. Let's break this down.
1. Horizontal and Vertical Lines
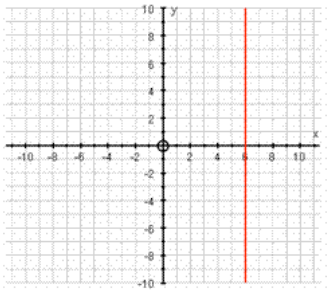
- Vertical Line: Every point on this line has the same coordinate.
Example: If every point on the line has an coordinate of , the equation of the line is:
- This means that no matter the value, the value remains constant at .
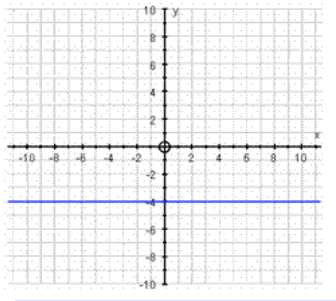
- Horizontal Line: Every point on this line has the same coordinate.
Example: If every point on the line has a coordinate of , the equation of the line is:
- This means that no matter the value, the value remains constant at
Important Notes:
- The equation of the axis is .
- The equation of the axis is .
Example Questions
Example 1:
Question: Draw the line given by the equation .
Solution:
- Here, the line is vertical because is constant at .
- The line will be a straight line parallel to the axis, passing through the point () and extending infinitely in the direction.
Example 2:
Question: Draw the line given by the equation .
Solution:
- Here, the line is horizontal because is constant at .
- The line will be a straight line parallel to the axis, passing through the point () and extending infinitely in the direction.
2. Drawing Straight Line Graphs from Their Equation
When asked to draw a straight line graph from its equation, there are some straightforward steps you can follow. This method works for most types of straight-line equations, including the more common ones like .
Steps to Draw the Graph:
- Choose Sensible Values for
- Substitute into the Equation
- Calculate Four Points
- Plot the Points
- Join the Points with a Straight Line
- Choose Sensible Values for :
- Pick values for that are easy to calculate with and that will fit on your graph paper.
- A good range might be .
- Substitute into the Equation:
- For each value of you have chosen, substitute it into the equation to find the corresponding value.
- For example, if your equation is :
- For .
- For .
- Calculate Four Points:
- Repeat the substitution to get at least four points.
- This helps ensure accuracy when plotting your graph.
- Plot the Points:
- Plot each of the points you've calculated on your graph paper.
- Join the Points with a Straight Line:
- Once you have plotted the points, use a ruler to draw a straight line through them.
- All the points should lie on this line.
3. Types of Straight Line Equations
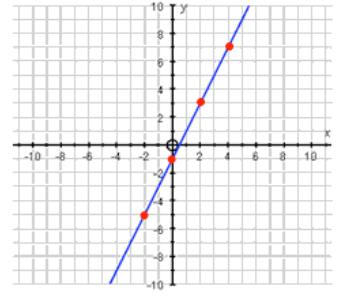
- Type 1:
- This is the most common form of a straight line equation, where represents the gradient (or slope) of the line, and c represents the intercept (the point where the line crosses the axis).
Example:
- Here, and .
- To plot this graph:
- Choose values for (e.g., ).
- Substitute these into the equation to find the corresponding values:
- For
- For
- For
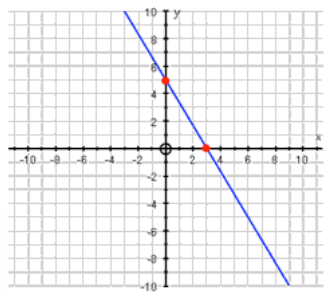
- Plot the points , and on a graph.
- Draw a straight line through these points.
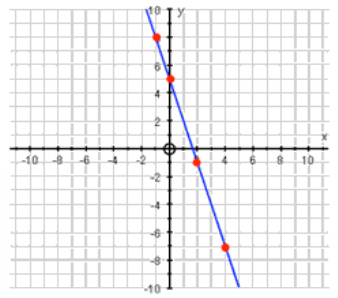
Example:
- Here, and .
- To plot this graph:
- Choose values for (e.g., ).
- Substitute these into the equation to find the corresponding values:
- For
- For
- For
- Plot the points (), (), and () on a graph.
- Draw a straight line through these points.
- Type 2:
- Another common form, where , and are constants. This form is often used when and are on the same side of the equation.
Example:
- To plot this graph:
- Rearrange the equation to find in terms of , or directly substitute values for to find corresponding values.
- For example:
- For .
- For .
- Plot the points and on a graph.
- Draw a straight line through these points.
Example:
- To plot this graph:
- Rearrange the equation to find in terms of , or directly substitute values for to find corresponding values.
- For example:
- For , so .
- For , so .
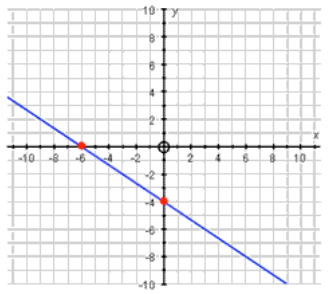
- Plot the points () and () on a graph.
- Draw a straight line through these points.
4. Understanding the Equation of a Line:
The equation is a fundamental concept in algebra and describes a straight line. Let's break down what each part of this equation represents:
-
- : This represents the gradient or steepness of the line.
- The bigger the number, the steeper the line.
- If is positive, the line slopes upwards as you move from left to right.
- If is negative, the line slopes downwards.
- Parallel lines have the same gradient.
- : This is the intercept.
- It tells you where the line crosses the axis.
- The intercept is the value of when .
Example of Using the Equation: Let's consider an example with the equation
- Gradient (): The gradient is , meaning the line rises by units for every unit it moves to the right. This line slopes upwards.
- -intercept (): The y-intercept is , meaning the line crosses the axis at .
Steps to Graphing :
- Identify the Gradient ():
- If , then the line goes up units for every unit you move to the right.
- Identify the intercept ():
- If , the line crosses the axis at .
- Plot the intercept:
- Start by plotting the point () on the graph.
- Use the Gradient to Plot the Next Point:
- From (), move up units and unit to the right. This takes you to the point ().
- Draw the Line:
- Use a ruler to draw a straight line through the points you've plotted.
5. Working Out the Equation of a Line
Using the equation of a straight line, , we can figure out the equation of a line just by looking at it on a graph! Here's how to do it:
Step-by-Step Process:
- Identify Two Points on the Line
- Calculate the Gradient ()
- Find the Y-Intercept ()
- Write the Equation
- Identify Two Points on the Line:
- First, pick two points on the line that are easy to read off the graph. For instance, you might pick points where the line crosses the grid intersections.
- Calculate the Gradient ():
- The gradient (or slope) of the line tells you how steep the line is.
- To calculate the gradient, use the formula:
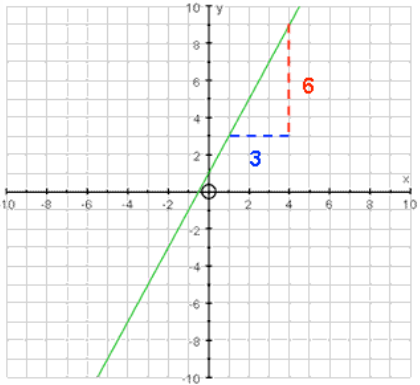
- Draw a right-angled triangle between the two points you've chosen. The vertical side represents the "Change in " and the horizontal side represents the "Change in ".
- For example, if the change in is and the change in is , the gradient would be:
- Find the Y-Intercept ():
- The intercept is where the line crosses the . This point is where .
- In our example, if the line crosses the axis at , then .
- Write the Equation:
- Now, combine your gradient () and intercept () to write the equation of the line.
- For our example, with and , the equation is:
6. Using Straight Line Graphs to Solve Simultaneous Equations
Straight line graphs can also be used to solve simultaneous equations. This graphical method involves plotting the equations as lines on a graph and finding the point where they intersect. The coordinates of this intersection give the solution to the simultaneous equations.
Step-by-Step Process:
- Write Down the Equations
- Rearrange the Equations (if necessary)
- Create Tables of Values
- Plot the Lines on the Graph
- Find the Intersection
- Write Down the Solution
- Write Down the Equations:
- You will typically be given two equations in the form:
- For example, let's consider the following pair of simultaneous equations:
- Rearrange the Equations (if necessary):
- Ensure both equations are in the form .
- For , rearrange to get:
- For , rearrange to get:
- Create Tables of Values:
- Choose simple values for , substitute them into each equation, and solve for .
- For
- For
- Plot the Lines on the Graph:
- Draw the axes on graph paper and plot the points from your tables of values.
- For , plot the points and .
- For , plot the points and .
- Draw the lines through these points.
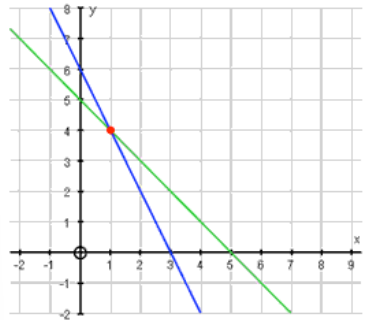
- Find the Intersection:
- The point where the two lines intersect is the solution to the simultaneous equations.
- In this example, the lines intersect at .
- Write Down the Solution:
- The coordinates of the intersection give the solution:
- Therefore, the solution to the simultaneous equations is and .
Example:
Solve the simultaneous equations:
Steps:
- Equation 1: rearranges to .
- Equation 2: rearranges to .
Tables of Values:
Intersection: The lines intersect at , so the solution is and .