Scattergraphs (OCR GCSE Maths): Revision Notes
Scattergraphs
Why Do We Use Statistical Diagrams?
- By using scatter graphs, we can often determine whether two variables are related and to what extent.
- They help us see patterns and compare different sets of data.
- Statistical diagrams, if done correctly, present data in a clear and easy-to-understand way.
- The world is full of statistics, and it's hard to make sense of raw data. We use statistical diagrams because:
Key Features of Scatter Graphs
- Axes: The two variables we want to compare are placed on the x-axis and y-axis.
- Points: Each point on the graph represents a pair of values for the two variables.
- Correlation: Scatter graphs are particularly useful for identifying correlation between variables:
- Positive Correlation: As one variable increases, the other also increases.
- Negative Correlation: As one variable increases, the other decreases.
- No Correlation: There is no clear relationship between the two variables.
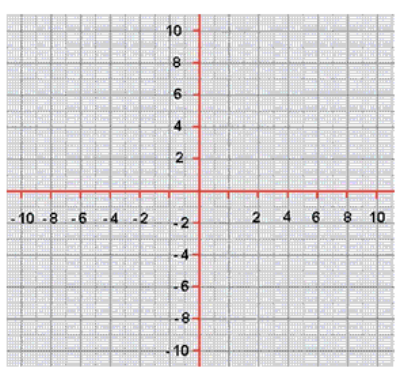
1. Drawing the Correct Scale
One of the most common mistakes students make is getting the scale wrong when drawing scatter graphs. A correct scale should:
- Increase in equal steps on both the and .
- Be evenly spaced, with no gaps or uneven intervals.
- Properly handle negative numbers, especially for data that requires a range of positive and negative values.
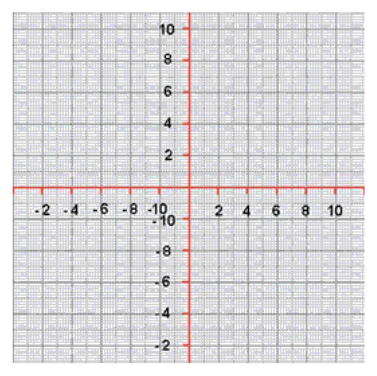
Examples of Incorrect Scales:
-
Negative Numbers: In one example, the person mixed up negative numbers, placing them out of order. Remember, negative numbers should decrease in value as you move left or down.
-
Inconsistent Spacing: In another case, the spacing between values was inconsistent, with different intervals for positive and negative numbers. This will lead to inaccurate graphs.
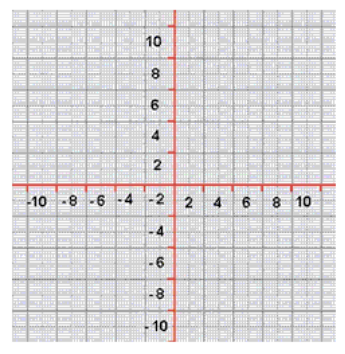
- Spaces Around the Origin: Sometimes, there are unequal spaces around the centre (origin), which distorts the graph's overall appearance.
2. Drawing a Scatter Graph
1. Decide on the Scale
- Choose an appropriate scale for both the and that will fit the data comfortably.
- Ensure the scales increase in equal intervals and are labelled correctly. Include units if necessary (e.g., time in minutes).
2. Plot the Points
- Once the scale is set, mark each data point using a small dot or cross.
- Each pair of values in your data corresponds to one point on the graph.
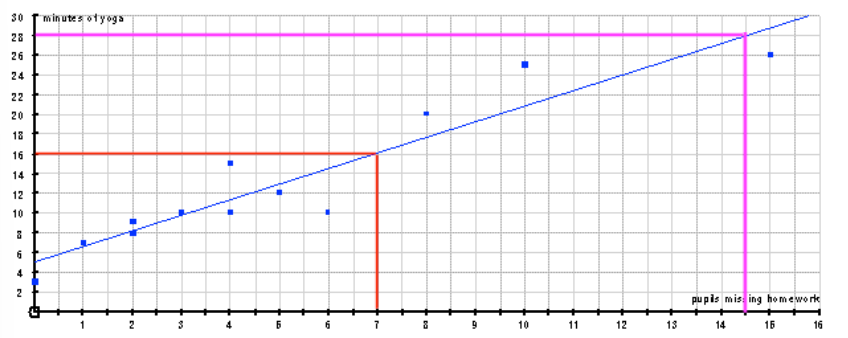
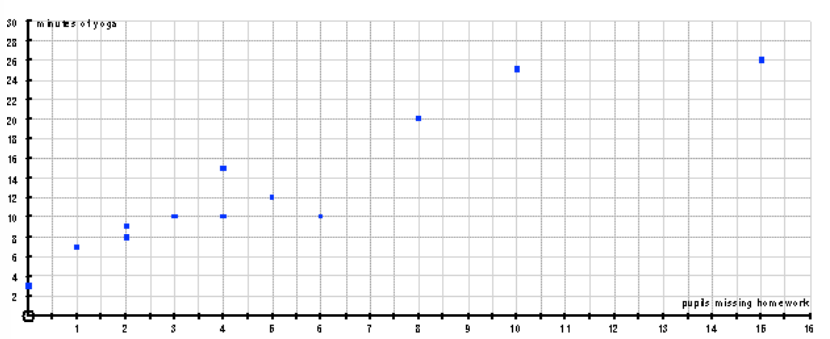
Worked Example:
Let's consider the following data on the number of pupils missing homework and the minutes of yoga required by the teacher to calm down:
| Pupils Missing Homework | Minutes of Yoga |
|---|---|
- Step 1: Label the as Pupils Missing Homework and the as Minutes of Yoga.
- Step 2: Plot the points for each pair, such as , etc.
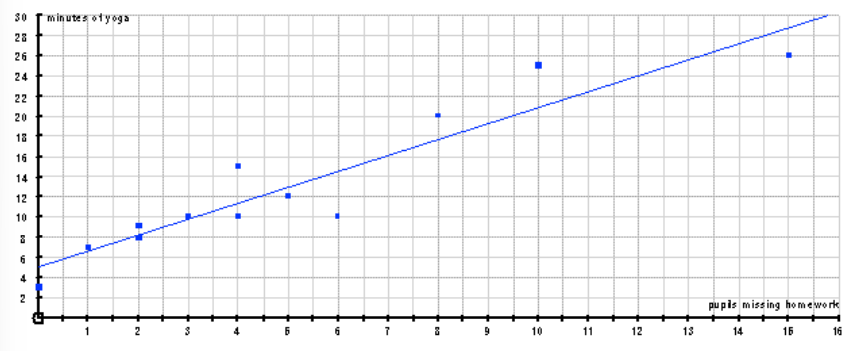
3. Line of Best Fit
A line of best fit helps show the general trend in the data. It should balance the points, with roughly the same number above and below the line.
Tips for Drawing a Line of Best Fit:
- Balance the points: Try to have an equal number of points above and below the line.
- Experiment: Use your ruler to find the best fit, but don't stress about making it perfect.
- The line does not need to start at the origin unless the data suggests that.
4. Correlation
Scatter graphs help identify different types of correlation between two variables. Correlation describes the relationship between the two variables on the scatter graph. There are two key factors to look at when determining correlation: direction and strength.
Direction:
- Positive Correlation: As one variable increases, the other also increases. The line of best fit will slope upwards.
- Negative Correlation: As one variable increases, the other decreases. The line of best fit will slope downwards.
- No Correlation: There is no clear pattern or relationship, and the points are scattered randomly.
Strength:
- Strong Correlation: The points are closely clustered around the line of best fit, showing a strong relationship.
- Weak Correlation: The points are more spread out, showing a weaker relationship.
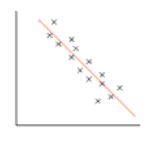
Example of Correlation Types:
-
Strong Negative Correlation: The line slopes downwards, and the points are close to the line.
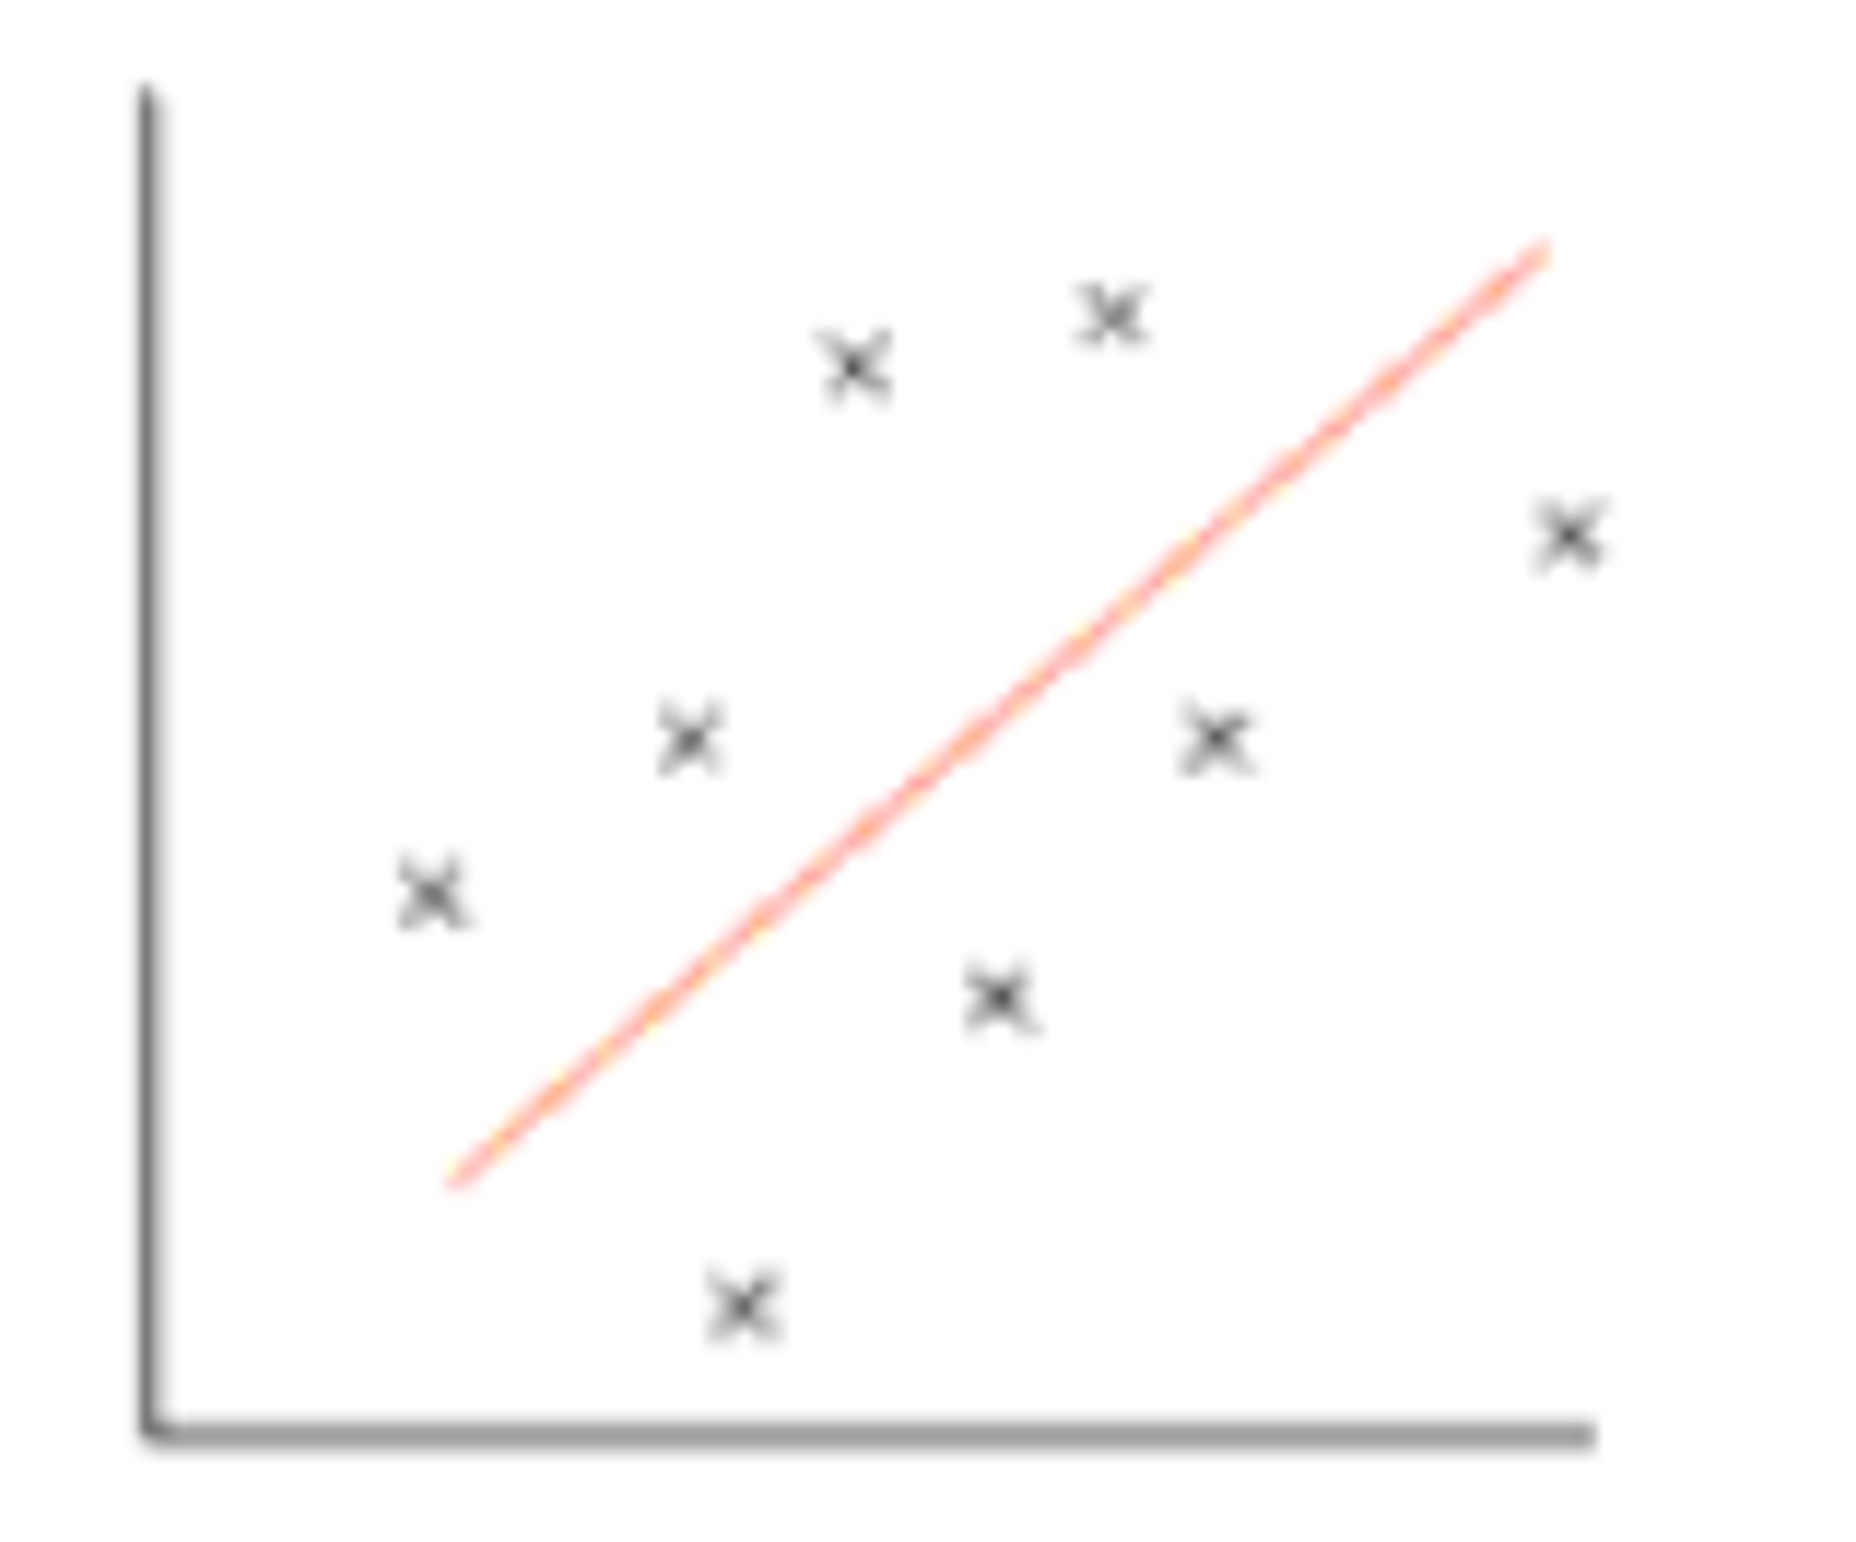
-
Weak Positive Correlation: The line slopes upwards, but the points are more spread out.
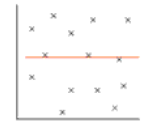
-
No Correlation: The points are scattered with no clear line.
In our example, there is a fairly strong, positive correlation: as the number of pupils missing homework increases, so do the minutes of yoga required by the teacher.
5. Using the Line of Best Fit for Predictions
Once the line of best fit is drawn, it can be used to predict values that are not in the original data set.
Worked Example:
- Question 1: If pupils miss their homework, how many minutes of yoga might the teacher need?
- Use the line of best fit to find the corresponding value for on the . Follow the line up and across to the y-axis: the teacher would likely need about minutes of yoga.
- Question 2: If the teacher does minutes of yoga, how many pupils might have missed their homework?
- Use the line of best fit to find the corresponding value for on the y-axis. Follow the line across and down to the x-axis: approximately pupils missed their homework.