Tree diagrams (OCR GCSE Maths): Revision Notes
Tree diagrams
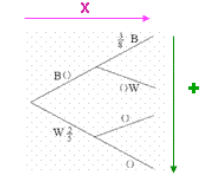
What are Tree Diagrams, and When Do You Use Them?
A tree diagram is a very powerful tool in probability, used to represent a series of events and their probabilities. They are particularly helpful when you have more than one event happening in a sequence or when the outcomes are not equally likely.
Tree diagrams can be used for both independent and non-independent events.
You use tree diagrams when there is more than one experiment or event happening, and you want to see all the possible outcomes clearly.
How to Use Tree Diagrams
Tree diagrams help you work out complex probability problems by breaking them down into smaller steps. Each branch of the tree represents a possible outcome, and the branches show the probabilities for each stage of the experiment.
The Two Crucial Rules of Tree Diagrams
- Multiply probabilities going across the branches.
- This is used when calculating the combined probability of a sequence of events (e.g., tossing a coin twice).
- The probability for the entire path of events is the product of the probabilities for each branch.
- Add probabilities going down the branches.
- This is used when you want to calculate the total probability of an outcome that can happen in multiple ways.
- If there are several branches that lead to the same result, you add the probabilities from each path.
Worked Example 1: Drawing Two Cubes with Replacement
Example Scenario
Sarah has 12 cubes in a bag:
- 5 red cubes
- 7 blue cubes She draws one cube, replaces it, and then draws a second cube. We want to calculate the probability that both cubes are of the same colour.
Step 1: Setting up the Tree Diagram
We start by dividing the problem into two steps: the first pick and the second pick. Since the cubes are replaced after each pick, the probability remains the same for both picks.
Probabilities for the First Pick
- The probability of picking a red cube is:
- The probability of picking a blue cube is:
Probabilities for the Second Pick
Because Sarah replaces the cube after each draw, the probabilities for the second pick are exactly the same as the first pick:
- The probability of picking a red cube again is:
- The probability of picking a blue cube is:
Step 2: Using the Tree Diagram to Find the Probability of Both Cubes Being the Same Colour
Now, we'll multiply the probabilities across the branches to find the combined probability of each event.
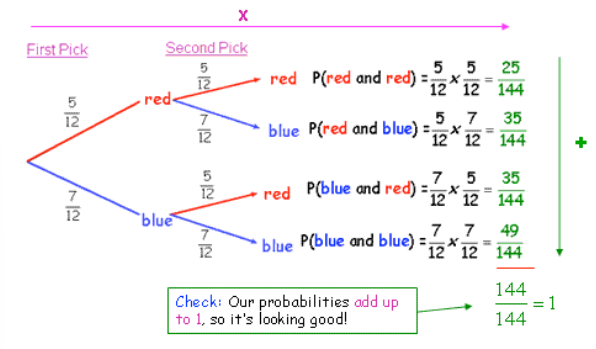
- Red, then Red:
- Blue, then Blue:
These two paths represent the possibilities of Sarah drawing two cubes of the same colour.
Step 3: Adding the Probabilities
Now, since there are two ways for Sarah to get two cubes of the same colour (red-red or blue-blue), we need to add the probabilities of these two outcomes:
We can simplify this fraction:
Thus, the probability that Sarah draws two cubes of the same colour is 37/72.
Worked Example 2: Winning Two Games (Independent Events)
Scenario:
Hannah and George are playing two games: Scrabble and Monopoly. The probability that Hannah wins at Scrabble is 0.7, and the probability that George wins at Monopoly is 0.65. We are asked to find the probability that George wins both games.
Step 1: Setting Up the Tree Diagram
We need to consider two events:
- Scrabble outcome: Either Hannah wins or George wins.
- Monopoly outcome: Either Hannah wins or George wins. Since these events are independent, the outcome of Scrabble does not affect the outcome of Monopoly.
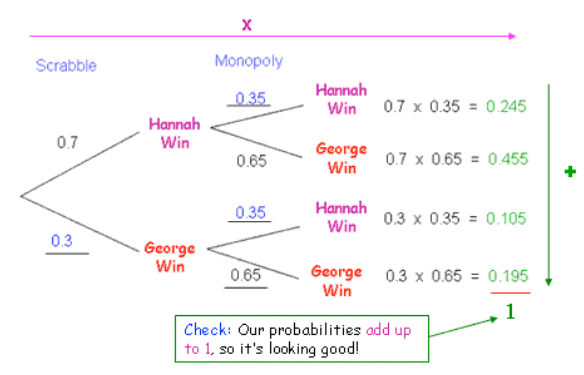
Probabilities for Scrabble:
- Probability that Hannah wins Scrabble:
- Probability that George wins Scrabble:
Probabilities for Monopoly:
- Probability that George wins Monopoly:
- Probability that Hannah wins Monopoly:
Step 2: Multiplying Across the Branches
Now that we have the probabilities, we can multiply the probabilities across the branches to calculate the probability of each combined event.
-
Hannah wins both games:
-
Hannah wins Scrabble, George wins Monopoly:
-
George wins Scrabble, Hannah wins Monopoly:
-
George wins both games:
Step 3: Adding Down the Branches
To ensure that the total probabilities are correct, we can add all the possible outcomes, which should sum up to 1.
- Total probability:
This shows that the probabilities are consistent.
Step 4: Finding the Probability of George Winning Both Games
From our tree diagram, the probability of George winning both Scrabble and Monopoly is:
Worked Example 3: Drawing Beads without Replacement
Scenario:
Sarah has a bag with 12 beads:
- 5 red beads
- 6 blue beads
- 1 green bead Sarah picks two beads without replacement. What is the probability that both beads she picks are of the same colour?
Step 1: Setting up the Tree Diagram
We need to break the problem down into two events:
- First pick: Sarah picks a bead.
- Second pick: Sarah picks a second bead without replacing the first one. Since the first bead is not replaced, the total number of beads decreases after the first pick, and this affects the probabilities for the second pick.
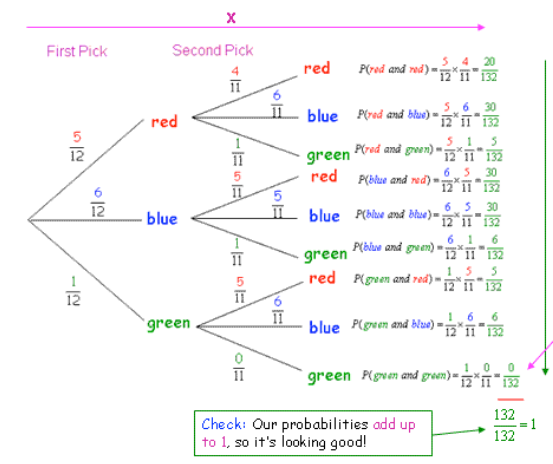
Step 2: Probabilities for the First Pick
- Probability of picking a red bead:
- Probability of picking a blue bead:
- Probability of picking a green bead:
Step 3: Probabilities for the Second Pick (Dependent on the First Pick)
Since the first bead is not replaced, the total number of beads decreases to 11. The probabilities for the second pick depend on what Sarah picked first:
- If Sarah picked a red bead first:
- Now there are only 4 red beads left out of 11.
- If Sarah picked a blue bead first:
- Now there are only 5 blue beads left out of 11.
- If Sarah picked a green bead first:
- Since there is only one green bead in the bag, no more green beads can be picked, so this branch ends here with no second green bead available.
Step 4: Using the Tree Diagram to Find the Probability of Picking Two Beads of the Same Colour
- Red, then Red:
- Blue, then Blue:
- Green, then Green: Since there is only one green bead, the probability of picking two green beads is 0.
Step 5: Adding the Probabilities
Now, to find the probability of Sarah picking two beads of the same colour, we add the probabilities for each branch that satisfies this condition:
We can simplify this fraction:
Thus, the probability that Sarah picks two beads of the same colour is 25/66.
Worked Example 4: Going to the Gym
Scenario:
The probability that I go to the gym on Monday is 0.3. If I go to the gym on Monday, the probability that I go again on Tuesday is 0.1. If I don't go on Monday, the probability of going on Tuesday stays at 0.3.
We are asked to calculate:
- The probability that I go to the gym on both days.
- The probability that I go to the gym on just one day.
Part (a): Probability of Going to the Gym on Both Days
In this case, I need to go to the gym on both Monday and Tuesday. This means:
- The probability I go on Monday is 0.3.
- Given that I went on Monday, the probability that I also go on Tuesday is 0.1.
To find the overall probability of going on both days, we multiply the probabilities across the branches:
So, the probability of going to the gym on both Monday and Tuesday is 0.03.
Part (b): Probability of Going to the Gym on Just One Day
For this part, there are two possible ways to go to the gym on just one day:
- I go to the gym on Monday, but not on Tuesday.
- I don't go to the gym on Monday, but I go on Tuesday. Let's calculate the probabilities for both situations:
Case 1: Going on Monday but not on Tuesday
- The probability of going on Monday is 0.3.
- Given that I went on Monday, the probability of not going on Tuesday is 0.9. Thus, the probability of going on Monday but not Tuesday is:
Case 2: Not going on Monday but going on Tuesday
- The probability of not going on Monday is 0.7.
- Given that I didn't go on Monday, the probability of going on Tuesday is 0.3. Thus, the probability of not going on Monday but going on Tuesday is:
Adding the Probabilities for One-Day Gym Visit
To find the probability of going to the gym on just one day, we add the two cases where I go on either Monday or Tuesday (but not both):
So, the probability of going to the gym on just one day is 0.48.