Speed, Displacement, Velocity, and Acceleration (Junior Cert Science): Revision Notes
Speed, Displacement, Velocity, and Acceleration
Introduction to motion
When we describe how objects move, we need to understand several related but different concepts. This note will help you understand speed, displacement, velocity, and acceleration, and how to represent motion using graphs. These concepts are fundamental to understanding motion in physics.
Speed
Speed tells us how quickly an object moves from one place to another. It is an important measurement in everyday life, from estimating journey times to road safety.
What is speed?
Speed measures how fast an object changes its position. To calculate speed, we need to know two things:
- The distance travelled (measured in metres, m)
- The time taken (measured in seconds, s)
The formula for calculating speed is:
The units of speed are metres per second, written as or .
Different speeds in our world
Different objects and activities have very different speeds. Here are some examples:
| Activity/Object | Speed () |
|---|---|
| Walking | |
| Car at km/hour | |
| Cheetah | |
| Falcon diving | |
| Sound | |
| Jet fighter | |
| Space shuttle | |
| Light travelling through a vacuum |
Exam tip: Always check that your units are correct. If distance is given in kilometres, convert it to metres before calculating speed. If time is given in minutes, convert it to seconds.
Worked example: calculating speed
Worked Example: Calculating Speed
Question: An athlete runs a m race in minutes. What is their average speed?
Solution:
Step 1: Convert the time to seconds
- minutes seconds
Step 2: Write out the formula
Step 3: Substitute the values
Displacement
While distance tells us how far an object has travelled, displacement gives us more specific information about the object's change in position.
What is displacement?
Displacement is the distance travelled in a given direction.
This is an important distinction. An object might travel a long distance but end up close to where it started. In such cases, the displacement would be small even though the distance travelled was large.
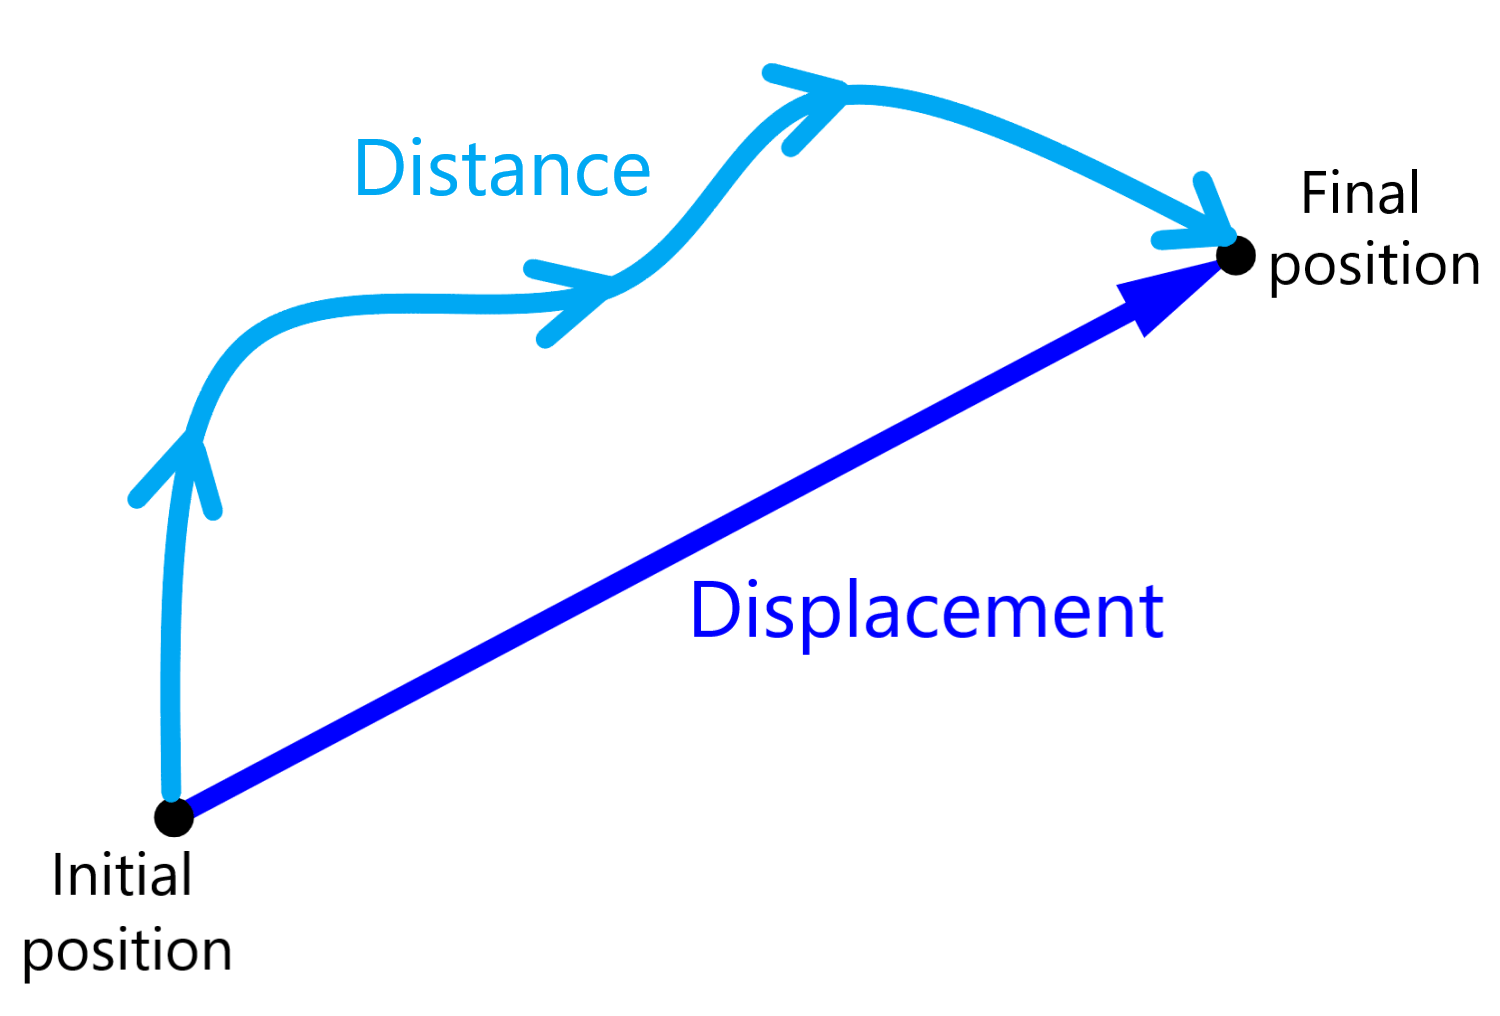
Displacement depends only on start and finish positions
The key thing to remember is that displacement only cares about:
- Your starting position
- Your finishing position
It doesn't matter what pathway you took to get there. The displacement is always the straight-line distance between these two points, measured in a specific direction.
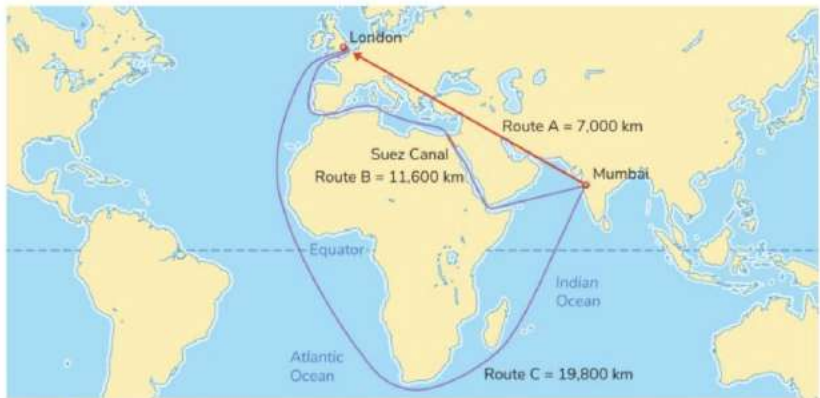
This world map shows an excellent example. A boat travelling from London to Mumbai could take three different routes:
- Route A through the Suez Canal: km
- Route B alternative route via Suez Canal: km
- Route C around the Cape of Good Hope: km
The distance travelled is very different for each route. However, the displacement at the end of each journey is approximately km (the straight-line distance from London to Mumbai in a given direction). This shows that displacement is independent of the pathway taken.
Velocity
Velocity is closely related to speed, but includes information about direction.
What is velocity?
Velocity is speed in a given direction. This means that to describe velocity fully, you must state both:
- How fast the object is moving
- The direction in which it is moving
The formula for velocity is:
The difference between speed and velocity
The terms speed and velocity are often used interchangeably in everyday conversation, but in physics they have different meanings:
- Speed only tells you how fast something is moving
- Velocity tells you how fast something is moving AND in which direction
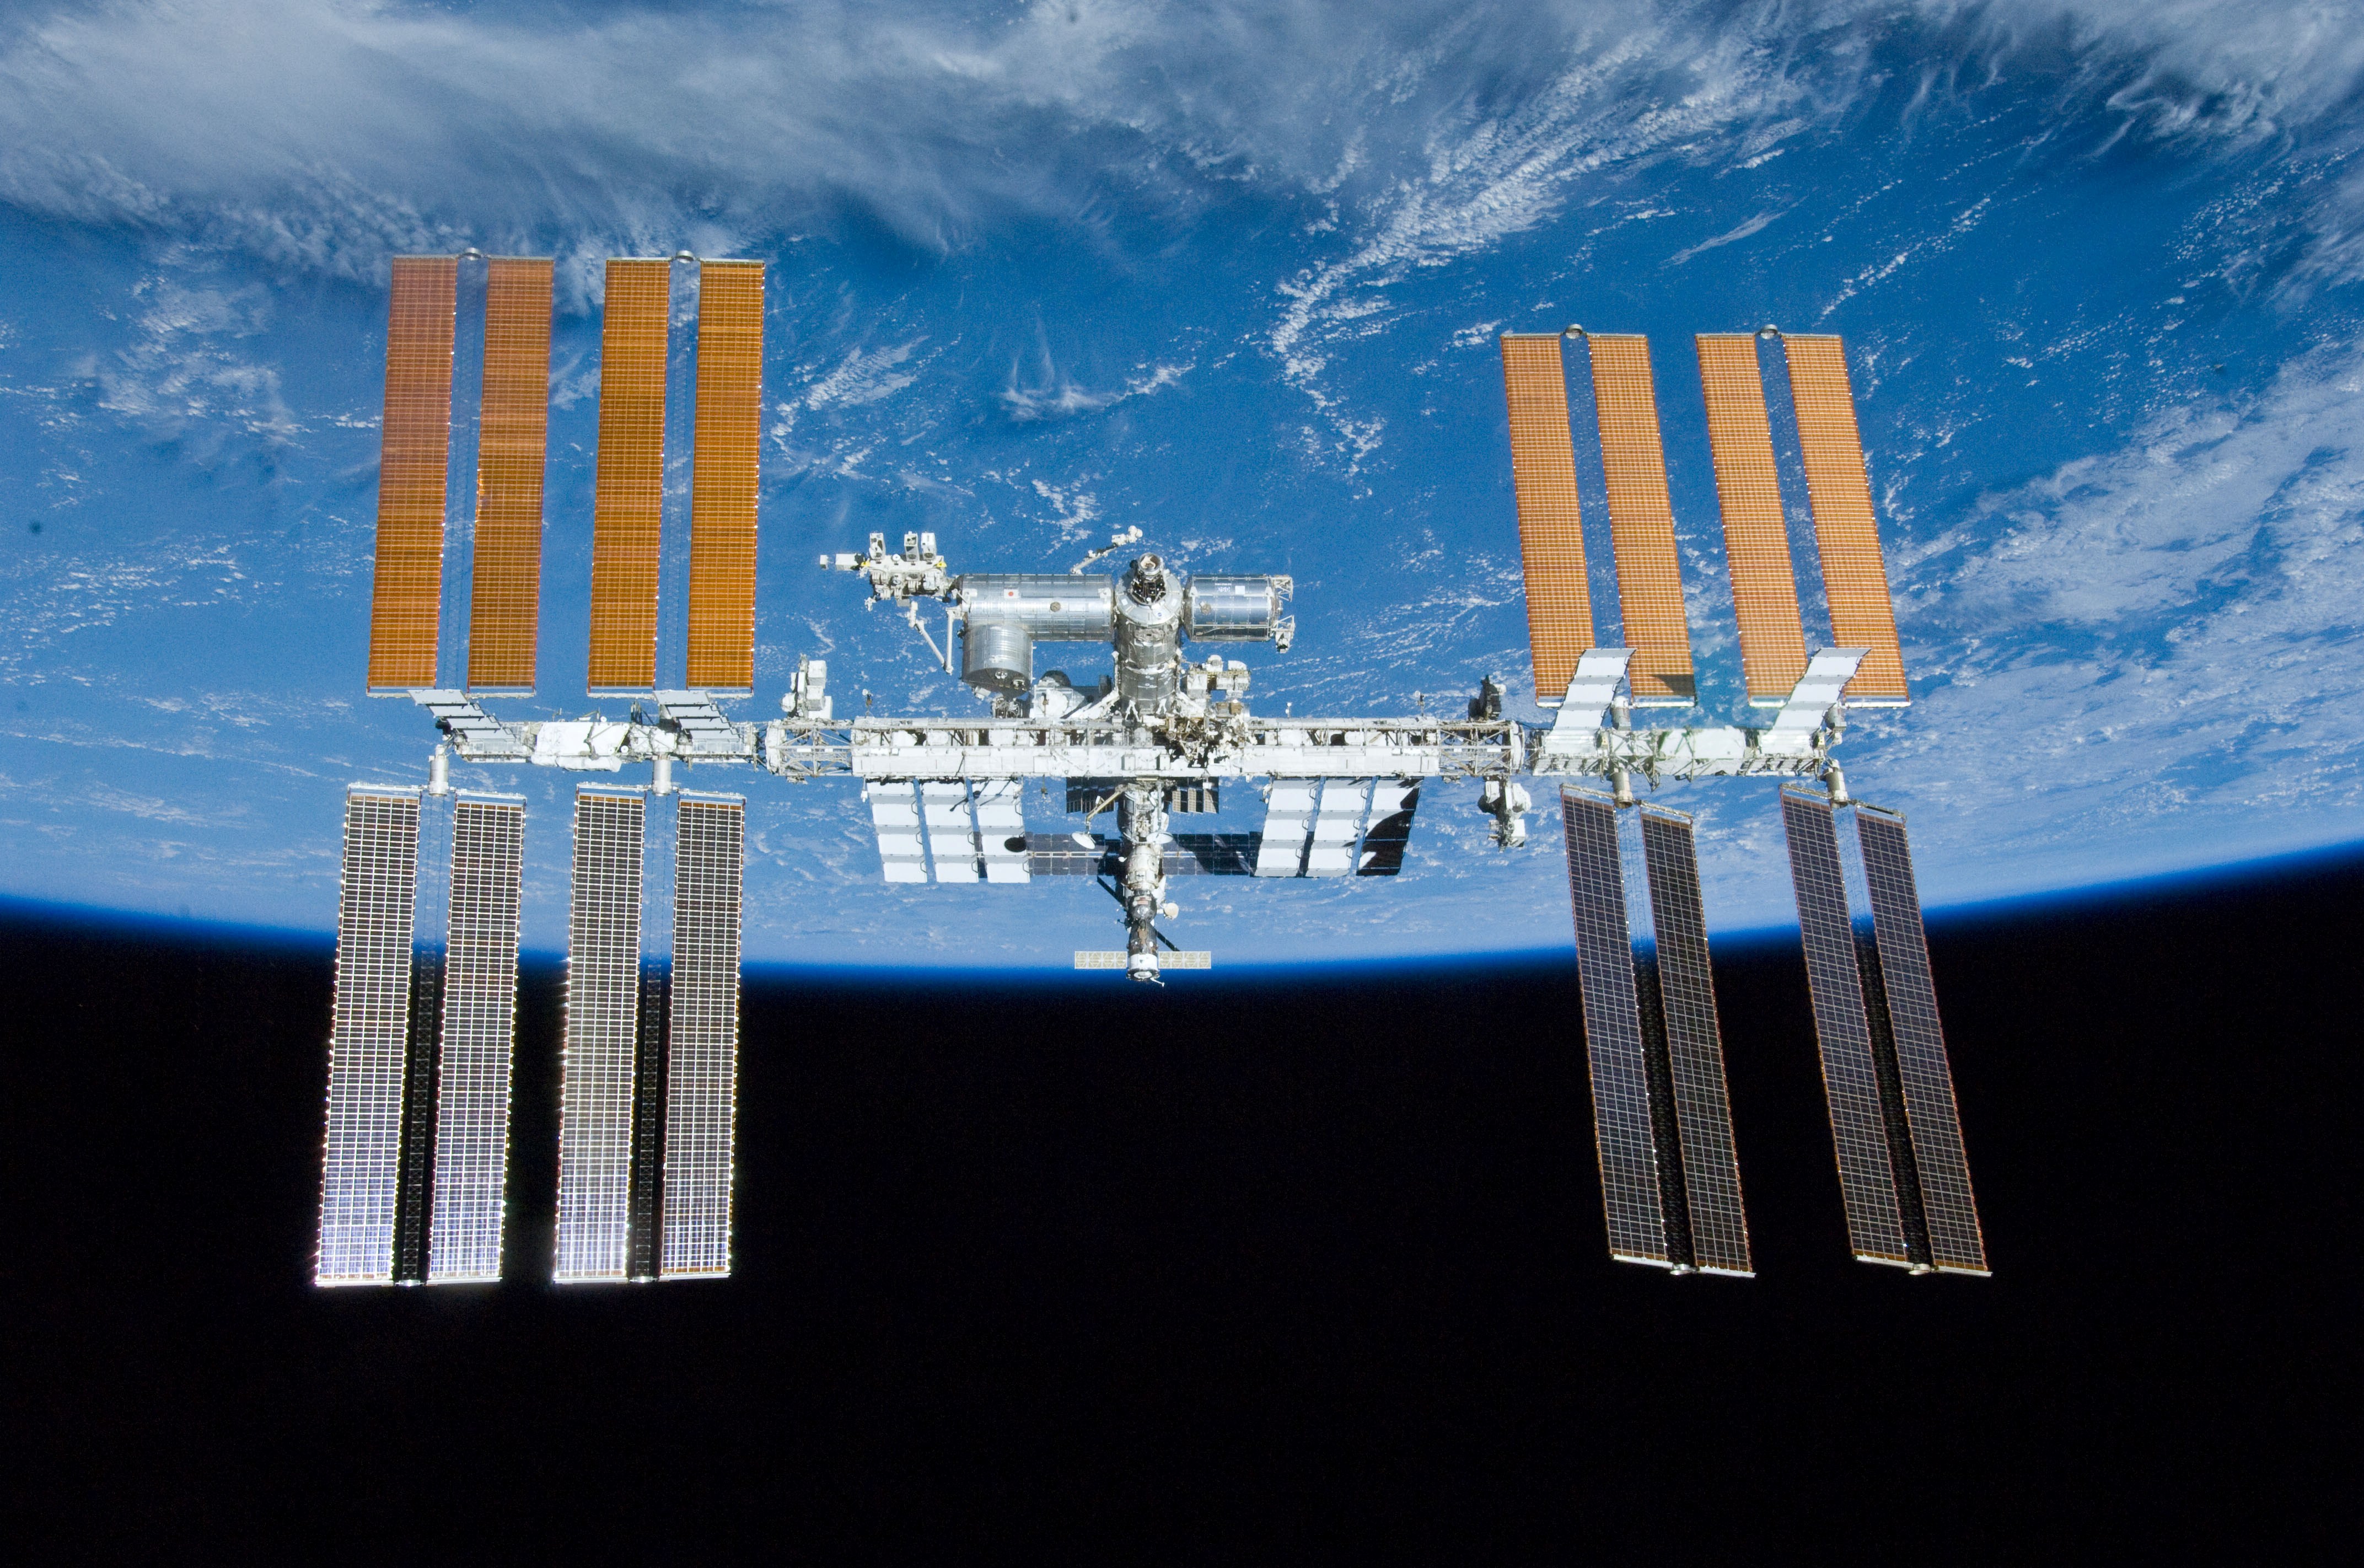
For example, the International Space Station orbits Earth at a constant speed of approximately m s⁻¹. However, its velocity is constantly changing because it is continuously changing direction as it orbits. Even though the speed stays the same, the direction changes, so the velocity changes.
Worked example: calculating velocity
Worked Example: Calculating Velocity
Question: A car travels a distance of km north in minutes. What is the average velocity of the car?
Solution:
Step 1: Convert to standard units
- Distance: km m
- Time: minutes s
Step 2: Write the formula
Step 3: Calculate
Notice that we include the direction (north) in our answer.
Distance-time graphs
Graphs provide a powerful visual way to represent and analyse motion. Distance-time graphs show how the distance travelled by an object changes over time.
How to draw a distance-time graph correctly
When drawing any graph in science, follow these four important steps:
- Label each axis with the quantity and its units
- Draw a correct scale on each axis (make sure the scale is even and clearly marked)
- Plot each point accurately using the data provided
- Join the points appropriately (with a straight line if the points follow a linear pattern, or a smooth curve if they follow a curved pattern)
Example data for a walker
Let's look at data collected for a person walking at constant speed:
| Time (s) | ||||||
|---|---|---|---|---|---|---|
| Distance (m) |
This data shows that the walker travels metres every second, indicating constant speed.
Reading values from a distance-time graph
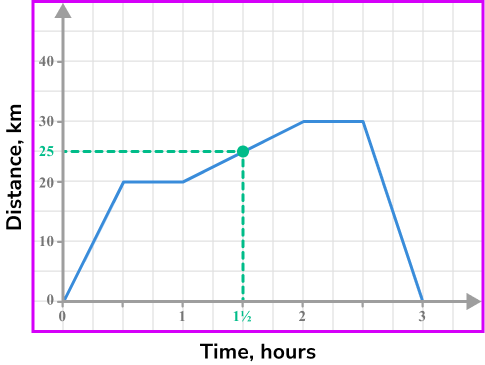
To find values from a distance-time graph:
- Find the value you want on one axis
- Draw a horizontal line across to meet the plotted line
- Draw a vertical line down to meet the time axis
- Read the corresponding value
This technique allows you to find the time for any given distance, or the distance at any given time.
Calculating speed from a distance-time graph
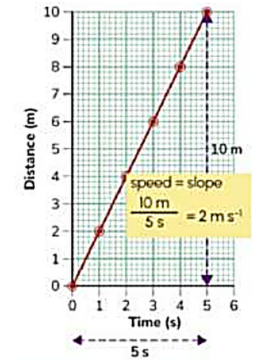
One of the most useful features of distance-time graphs is that the slope (gradient) of the line tells you the speed.
To calculate speed from the graph:
- Choose two points on the line
- Find the vertical change (change in distance)
- Find the horizontal change (change in time)
- Calculate:
Worked Example: Speed from Graph Slope
If distance changes by m over s:
Key Concept: The slope of a distance-time graph equals the speed of the object.
Interpreting different slopes on distance-time graphs
Real journeys often involve changing speeds or periods of rest. Here's what different features of distance-time graphs tell us:
- Steep slope = high speed (covering more distance in less time)
- Gentle slope = low speed (covering less distance in the same time)
- Horizontal line (no slope) = zero speed (the object has stopped)
- Downward slope = negative speed (moving back towards the starting point)
- Changing slope = changing speed (accelerating or decelerating)
Exam tip: On a distance-time graph, the steeper the slope, the faster the speed. A horizontal section means the object is stationary.
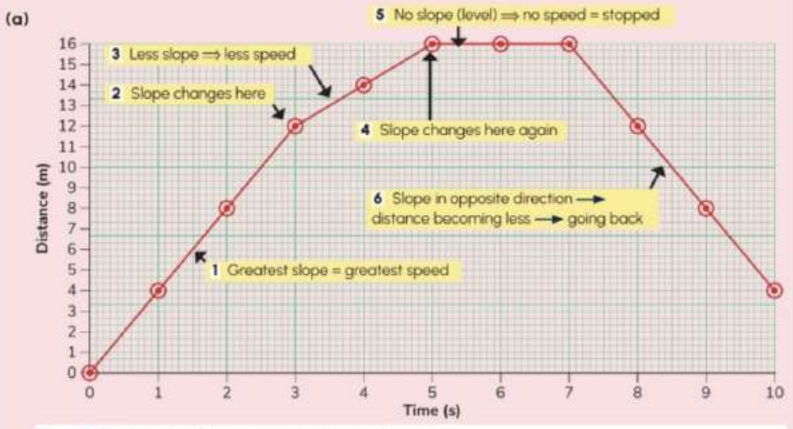
Worked example: interpreting a distance-time graph
Consider a student carrying out a fitness test, walking and running at different speeds. The distance travelled over time was recorded:
| Time (s) | |||||||||||
|---|---|---|---|---|---|---|---|---|---|---|---|
| Distance (m) |
Worked Example: Analysing a Complex Journey
Analysis of the graph:
- 0 to 3 seconds: The steepest slope shows the greatest speed. The student travels m in s, giving a speed of m s⁻¹
- 3 to 5 seconds: The slope changes and becomes less steep, indicating the student has slowed down
- 5 to 7 seconds: The horizontal line (no slope) means zero speed - the student has stopped
- 7 to 10 seconds: The downward slope shows the student is moving back towards the starting point
Using motion sensors in experiments
Modern technology allows us to measure motion very accurately. A motion sensor can be connected to a computer to plot graphs of distance versus time automatically.
Experiment: Measuring the speed of a trolley
- Place a trolley on a flat track
- Position a motion sensor to measure the distance from the trolley
- Connect the sensor to data-logging software
- Give the trolley different pushes and observe the graphs produced
The motion sensor measures the distance at regular time intervals. The data-logging software then plots this information, allowing you to:
- Calculate the speed directly from the slope of the graph
- Compare different speeds by examining different slopes
- Identify when the trolley is stationary (horizontal sections)
Acceleration
When an object's velocity changes, we say it is accelerating. Acceleration is one of the most important concepts in physics.
What is acceleration?
Acceleration is the change in velocity in one second.
More formally, acceleration is the rate of change of velocity. This means it measures how quickly velocity changes over time.
The formula for acceleration is:
The units of acceleration are metres per second per second, written as or .
Understanding the units of acceleration
The units can seem confusing at first. Let's break it down:
- It means "metres per second, per second"
- In other words, how many metres per second the velocity changes every second
- For example, an acceleration of means the velocity increases by every second
Positive and negative acceleration
- Positive acceleration means the velocity is increasing (speeding up)
- Negative acceleration (also called deceleration) means the velocity is decreasing (slowing down)
Worked example: calculating acceleration
Worked Example: Calculating Acceleration
Question: A car increases its velocity from m s⁻¹ to m s⁻¹ in seconds. What is its acceleration?
Solution:
Step 1: Write the formula
Step 2: Calculate the change in velocity
Step 3: Substitute into the formula
This means the car's velocity increases by every second.
Velocity-time graphs
Just as distance-time graphs help us visualise and analyse motion, velocity-time graphs show how velocity changes over time.
Imagine looking at a car's speedometer every second over seconds. As the car accelerates, the needle moves to show increasing velocity. A velocity-time graph captures this information in a visual format.
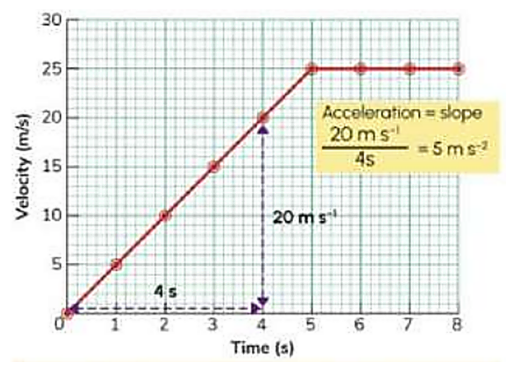
Example data for an accelerating car
| Time (s) | |||||||||
|---|---|---|---|---|---|---|---|---|---|
| Velocity () |
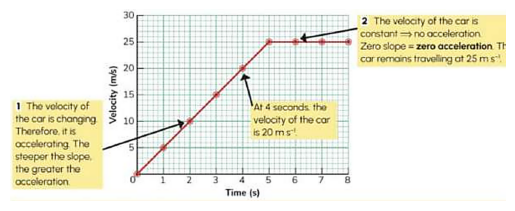
This data shows two distinct phases:
- 0 to 4 seconds: Velocity is increasing (positive acceleration)
- 4 to 8 seconds: Velocity remains constant at (zero acceleration)
Interpreting velocity-time graphs
Key features to understand:
- Upward slope = positive acceleration (velocity increasing)
- Steeper slope = greater acceleration
- Horizontal line = zero acceleration (constant velocity)
- Downward slope = negative acceleration/deceleration (velocity decreasing)
Key Concept: The slope of a velocity-time graph tells you the acceleration.
Calculating acceleration from a velocity-time graph
To find acceleration from a velocity-time graph, calculate the slope:
Worked Example: Acceleration from Graph Slope
From the graph above, in the first seconds the velocity changes from to :
This tells us that the velocity increases by every second during this time period.
Exam tip: On a velocity-time graph, a horizontal line means constant velocity (NOT zero velocity). The slope tells you the acceleration.
Measuring acceleration experimentally
Experiment: Measuring the acceleration of a trolley on an inclined track
Apparatus:
- Trolley
- Inclined track
- Motion sensor
- Books to raise one end of the track
- Data-logging software
Method:
- Set up the track with a gentle incline by placing books under one end
- Position the motion sensor at the top of the track
- Connect the sensor to data-logging software on a computer
- Place the trolley at the top and release it
- The sensor measures the velocity of the trolley at regular time intervals
- The software plots a velocity-time graph
- Calculate acceleration from the slope of the graph
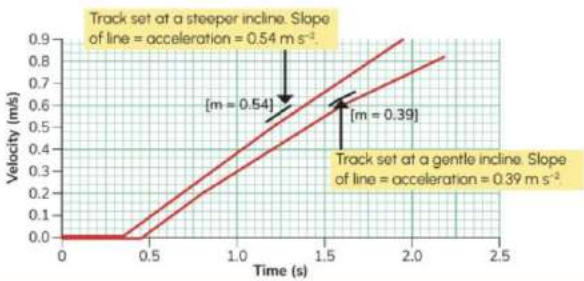
Results: When the experiment is repeated with different incline angles:
- Steeper incline: slope = (greater acceleration)
- Gentler incline: slope = (less acceleration)
This demonstrates that the steeper the incline, the greater the acceleration.
Sample data from trolley experiment
| Time (s) | ||||||||
|---|---|---|---|---|---|---|---|---|
| Velocity () |
The velocity increases by every second for the first seconds, then remains constant. This gives an acceleration of during the first phase.
Acceleration due to gravity
One of the most important accelerations in physics is the acceleration due to gravity, which affects all falling objects.
Free fall
When an object is dropped from a height, it accelerates towards the Earth due to the force of gravity. The velocity increases by approximately every second.
Here's what happens when a ball is dropped from a cliff:
| Time (s) | ||||||
|---|---|---|---|---|---|---|
| Velocity () |
On Earth, a falling body will accelerate at a rate of approximately .
This is true for all objects, regardless of their mass, as long as air resistance is negligible.
The effect of air resistance
In reality, air resistance affects how objects fall:
- In air: A feather falls slowly because air resistance opposes its motion. The large surface area of the feather experiences significant air resistance
- In a vacuum: With no air resistance, both a feather and a coin fall at exactly the same rate, accelerating at
This famous demonstration shows that all objects accelerate at the same rate when falling through a vacuum, regardless of their mass. Air resistance is the only reason why objects fall at different rates in everyday situations.
Important points about falling objects
- In the first tube (with air), the feather falls at an angle and more slowly due to air resistance
- In the second tube (vacuum), the feather falls straight down at the same rate as any other object
- This proves that gravity causes the same acceleration for all objects
- A stone will fall faster than a feather in air, but they accelerate at the same rate in a vacuum
Exam tip: Remember that the acceleration due to gravity on Earth is approximately . In reality, it's , but we often use for simpler calculations.
Practice with graphs
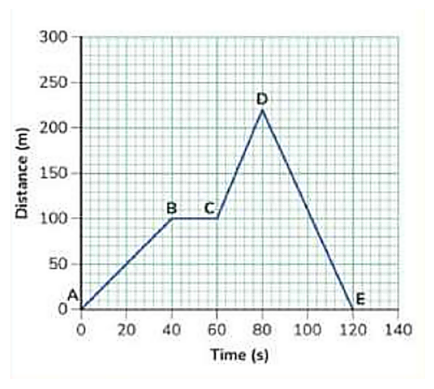
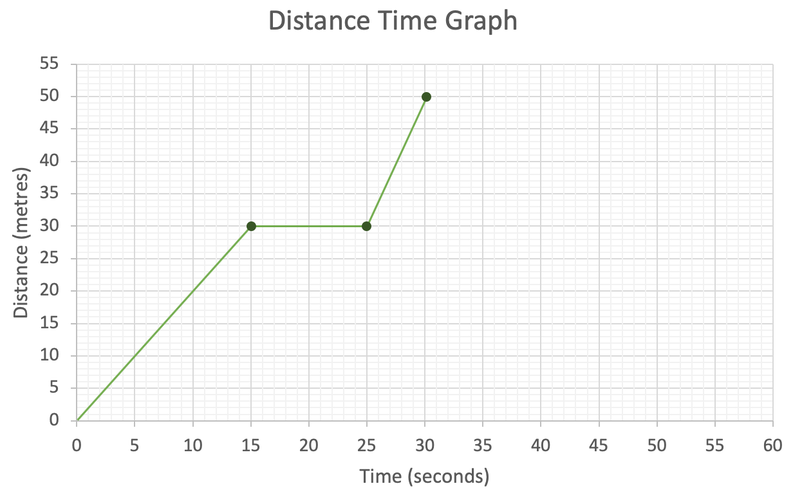
Let's look at a complete journey represented on a distance-time graph. This graph shows distance (in metres) against time (in seconds) with five marked points A, B, C, D, and E.
Analysing the journey:
- Point A to B: The person travels away from the starting point. The slope tells us the speed
- Point B to C: The slope changes, indicating a different speed
- Point C to D: The steepest section - this is where the person is travelling fastest
- Point D to E: A downward slope showing the person returning towards the starting point
By calculating the slope of each section, you can determine the speed during each phase of the journey.
Remember!
Key Points to Remember:
-
Speed is calculated by dividing distance by time: . Units are
-
Displacement is distance in a given direction. It depends only on starting and finishing positions, not on the path taken
-
Velocity is speed in a given direction: . Always include direction in your answer
-
On distance-time graphs: The slope tells you the speed. Steeper slopes mean faster speeds. A horizontal line means the object is stationary
-
Acceleration is the change in velocity per second: . Units are
-
On velocity-time graphs: The slope tells you the acceleration. A horizontal line means constant velocity (zero acceleration)
-
All falling objects accelerate at approximately on Earth (in the absence of air resistance), regardless of their mass