Acceleration & Deceleration (Leaving Cert Applied Maths): Revision Notes
Acceleration & Deceleration
Understanding acceleration and deceleration
Acceleration is when an object increases its velocity over time, while deceleration is when an object decreases its velocity over time. Both can be analysed using kinematic equations and velocity-time graphs.
The key kinematic equation we use is:
Where:
- = final velocity
- = initial velocity
- = acceleration (positive for speeding up, negative for slowing down)
- = time
Motion with constraints: the trapezoidal approach
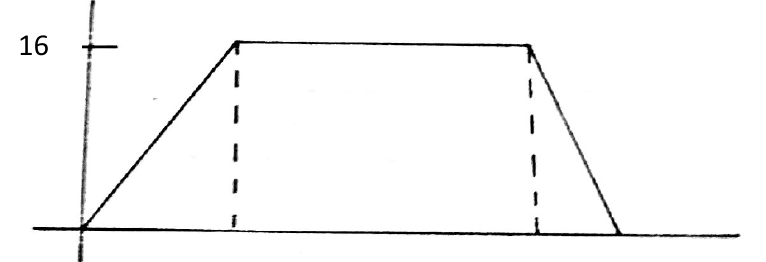
When an object has a speed limit, the motion creates a trapezoidal shape on a velocity-time graph. This occurs because the object follows a predictable three-stage pattern: it accelerates from rest to the maximum allowed speed, travels at constant maximum speed for some duration, and then decelerates back to rest.
Let's examine how to solve this step by step using the kinematic equation for both phases of motion:
Worked Example: Analysing Two-Phase Motion
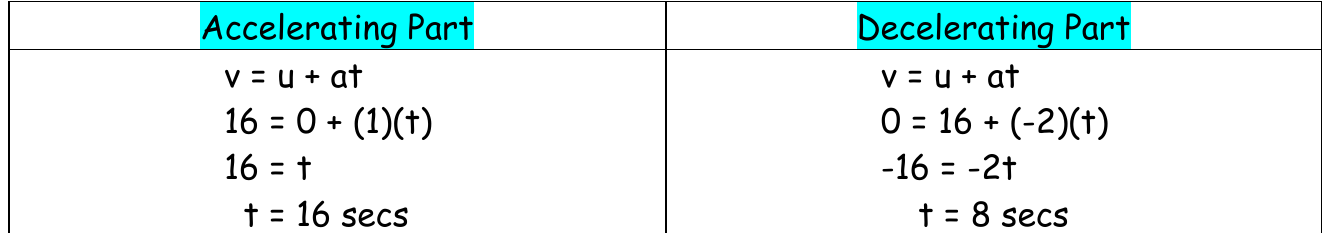
For the accelerating phase: Starting from rest (), the object reaches the speed limit ( m/s) with acceleration m/s². Using :
- Therefore seconds
For the decelerating phase: Starting from the speed limit ( m/s), the object comes to rest () with deceleration m/s²:
- Therefore seconds
Calculating total distance and time
The area under a velocity-time graph represents the total distance travelled. For our trapezoidal graph, this becomes a crucial tool for solving complex motion problems.
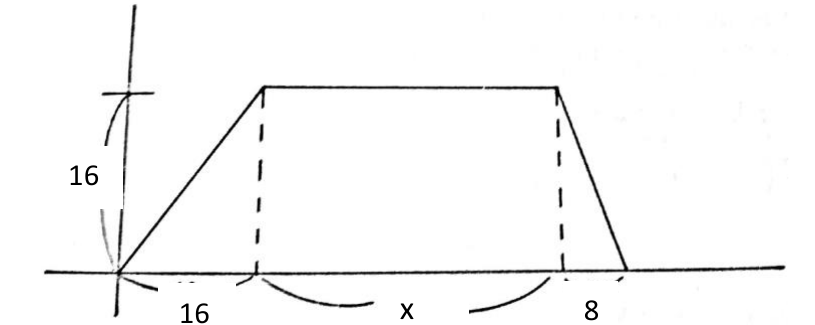
The total area consists of three distinct sections: two triangular sections representing the acceleration and deceleration phases, and one rectangular section representing the constant speed phase. Using the area formula and knowing the total distance is 300m, we can solve for the unknown constant speed duration and calculate the minimum total time.
Motion without constraints: the triangular approach
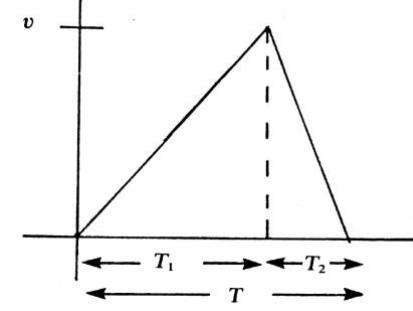
When there's no speed limit, the object accelerates to its maximum possible speed, then immediately decelerates back to rest. This creates a triangular velocity-time graph, which represents the most efficient motion profile for covering a given distance in minimum time.
The motion analysis becomes more straightforward but requires careful attention to the relationship between the two phases:
For the accelerating phase: (where is the maximum speed reached) For the decelerating phase: (due to the higher deceleration rate)
Finding the optimal solution
The total time becomes . This relationship is crucial for determining the most efficient motion profile.
Worked Example: Optimising Unconstrained Motion
Since the area under the triangular graph must equal the required distance (300m), we can solve:
Step 1: Set up the area equation
- Area =
Step 2: Solve for maximum velocity
- m/s
Step 3: Calculate total time
- Total time = seconds
Key problem-solving strategies
When approaching acceleration and deceleration problems, a systematic approach ensures accuracy and efficiency. The key is to break down complex motion into manageable phases and apply the appropriate kinematic principles to each.
Essential Problem-Solving Steps:
- Identify the motion phases - separate acceleration, constant speed, and deceleration
- Draw the velocity-time graph - this helps visualise the problem structure
- Apply kinematic equations to each phase separately
- Use area under the graph to relate distance to the motion parameters
- Set up equations based on the constraints given in the problem
Critical Points to Remember:
Always check whether speed limits apply to determine if you're dealing with trapezoidal or triangular motion profiles. The presence of constraints fundamentally changes the optimisation approach and solution method.
Exam tips
Success in acceleration and deceleration problems requires both conceptual understanding and practical technique. The most effective approach combines visual thinking with systematic calculation methods.
Exam Success Strategies:
- Always start by sketching the velocity-time graph to visualise the motion
- Remember that steeper gradients mean higher acceleration/deceleration rates
- The area under any velocity-time graph always equals the distance travelled
- When solving for minimum time, carefully consider whether speed limits apply
- Check your units throughout all calculations
Key Points to Remember:
- Acceleration increases velocity over time, while deceleration decreases it
- is your fundamental equation for uniform acceleration problems
- Velocity-time graphs reveal motion structure: trapezoidal for speed-limited motion, triangular for unconstrained motion
- Area under the graph always equals total distance travelled
- Higher deceleration rates result in shorter stopping times and can lead to overall time savings