Contours (Leaving Cert DCG): Revision Notes
Contours
What are contours?
A contour is a line drawn on a map that connects all points of equal elevation above a chosen reference level, typically sea level. Think of contours as imaginary lines that show the shape and height of the land surface on a flat map.
Contours are essential for understanding three-dimensional terrain on two-dimensional maps. They provide a visual representation of elevation changes across the landscape.
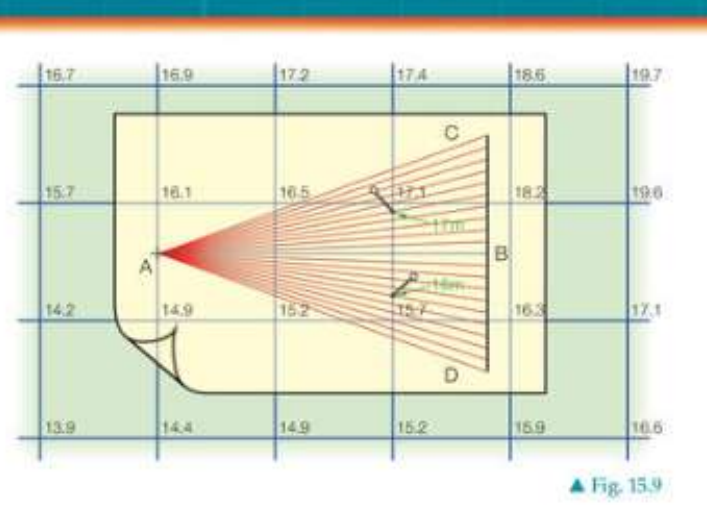
Contours help us understand the three-dimensional shape of terrain by showing:
- Hills and mountains - where contours form closed circles or ovals
- Valleys - where contours point uphill in a V-shape
- Steep slopes - where contours are closely spaced together
- Gentle slopes - where contours are widely spaced apart
Contour interval
The contour interval is the vertical distance between consecutive contour lines on a map. This means each contour line represents a specific height difference from the lines above and below it.
Understanding Contour Intervals
For example, if a map uses a 10-metre contour interval:
- One contour line might represent 100m above sea level
- The next line up would represent 110m above sea level
- The next line down would represent 90m above sea level
The choice of contour interval depends on:
- The terrain being mapped (mountainous areas need larger intervals)
- The map scale and intended use
- The level of detail required
Grid layout method for surveying
When surveying an area to create contour maps, the grid layout method is one of the most practical approaches. This systematic technique provides comprehensive elevation data across the survey area.
Setting up the grid system
Grid System Components
Surveyors establish a coordinate grid system across the site using:
- Regular square intervals (commonly 10m × 10m squares)
- Coordinate notation to identify each grid intersection (e.g., X10Y10, X20Y20)
- Precise elevation measurements taken at each grid intersection point

The size of grid squares affects survey accuracy. Smaller squares provide more detailed elevation data but require more time and effort to complete.
Recording elevation data
At each grid intersection, surveyors measure and record:
- The exact coordinate position
- The ground elevation at that point
- Any relevant terrain features
This creates a systematic database of elevation measurements across the entire survey area.
Interpolation of contours
Interpolation is the process of estimating where contour lines should be drawn between the surveyed grid points. Since contours rarely pass exactly through the measured grid intersections, we must calculate their approximate positions.
The interpolation process
Mathematical Approach to Interpolation
When interpolating contours between two surveyed points, precision is essential for accurate mapping results.
When interpolating contours between two surveyed points:
- Identify the elevation difference between adjacent grid points
- Calculate proportional distances to locate where specific contour elevations would occur
- Apply mathematical division to find the exact position along the line between points
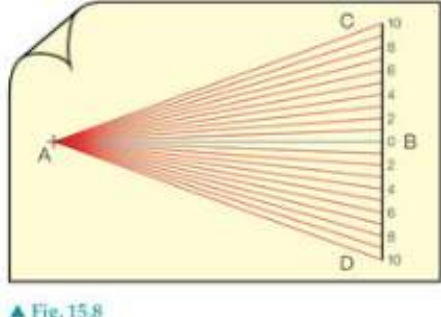
For example, if point A has an elevation of 138.3m and point B has an elevation of 141.7m:
- The difference is m over the distance between A and B
- A 140m contour would be located approximately or halfway between the points
Using templates for accurate interpolation
Templates are practical tools that help surveyors achieve accurate proportional divisions during interpolation. These tools work by:
- Dividing lines into equal parts automatically
- Eliminating the need for complex calculations in the field
- Ensuring consistent accuracy across the entire survey
Template Usage Process
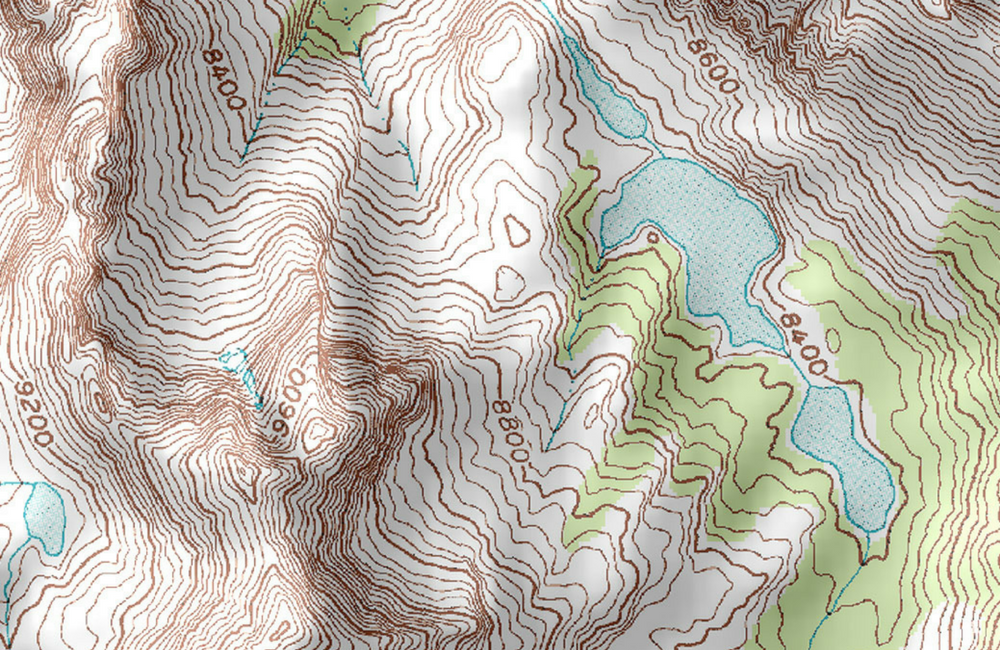
To use a template effectively:
- Draw a line of any length at one end
- Place the template perpendicular to this line
- Mark the required proportional divisions
- Join all marked points back to the starting point
This creates a fan of lines that can be used to find any proportional division needed for interpolation.
Practical application
The interpolation method allows surveyors to:
- Locate contour positions accurately between measured points
- Create smooth, continuous contour lines across the mapped area
- Ensure mathematical precision in the final contour map

The final result shows contour lines flowing smoothly across the grid, accurately representing the terrain's three-dimensional shape on a two-dimensional map.
Worked example
Worked Example: Creating Contours on a 1:200 Scale Map
Consider a practical surveying scenario where a 1:200 scale map needs contour lines drawn at 1-metre vertical intervals:
Step 1: Template construction Create a template with at least 2m spacing, with line CD longer than 30mm
Step 2: Proportional division
Use the template to divide grid square sides proportionally
Step 3: Contour location Find where the required elevation (e.g., 22m contour) intersects each grid line
Step 4: Line drawing Connect all points of equal elevation to create smooth contour lines
This systematic approach ensures accurate and professional contour mapping results.
Key Points to Remember:
- Contours connect points of equal elevation - they show the shape of the land on a flat map
- Contour intervals represent consistent vertical distances between lines
- Grid layout surveying provides systematic elevation data across an area
- Interpolation estimates contour positions between measured survey points
- Templates make proportional divisions easier and more accurate during field work