Tensile Testing (Leaving Cert Engineering): Revision Notes
Tensile Testing
What is tensile testing?
Tensile testing is the most important type of destructive test used in materials science. This test determines the ultimate tensile strength (UTS) of a material, which represents the maximum force a material can withstand before it breaks apart.
The main purpose of tensile testing is to understand how materials behave under pulling forces. Engineers use this information to select appropriate materials for different applications and to ensure structures can handle expected loads safely.
During a tensile test, engineers can observe and measure several important material properties including ductility, brittleness, malleability, toughness, hardness, and elasticity. This makes tensile testing one of the most comprehensive material characterisation methods available.
Test equipment and setup
Engineers use a universal testing machine to perform tensile tests. This machine applies controlled pulling forces to specially prepared test specimens.
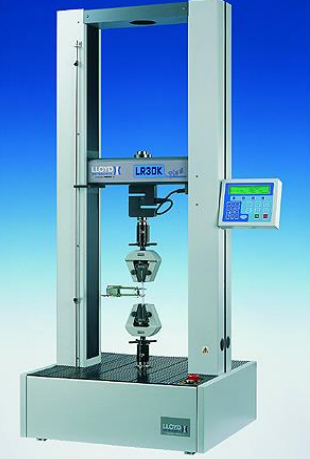
The test specimen is usually prepared as a flat piece for polymers or a cylindrical bar for metals. These specimens have a specific shape called a "dogbone" design that ensures the material fails in a controlled location during testing.
The dogbone shape is crucial because it creates a narrower gauge section in the middle of the specimen. This ensures that deformation and eventual failure occur in this controlled area, making measurements more accurate and repeatable.
The specimen gets clamped into the testing machine where it experiences gradually increasing tensile loads. As the load increases, the test piece becomes longer until it eventually breaks. Throughout this process, the machine measures both the applied force (in kN) and the resulting extension (in mm).
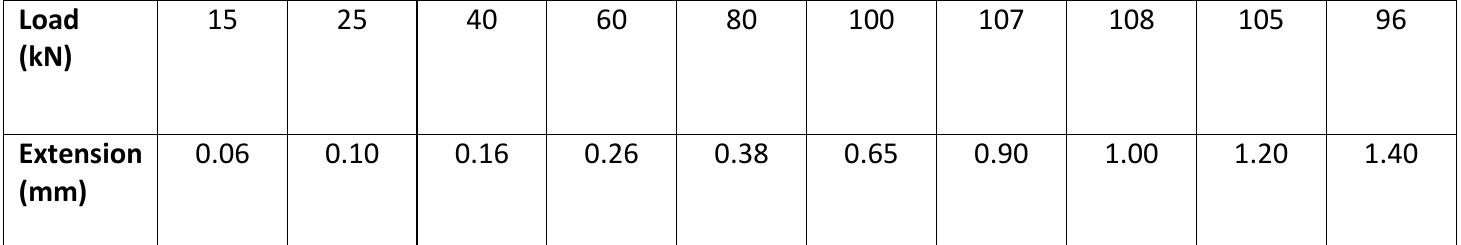
Load-extension graphs
When engineers first analyse tensile test results, they create a load-extension graph. This graph shows the relationship between the applied force and how much the material stretches.
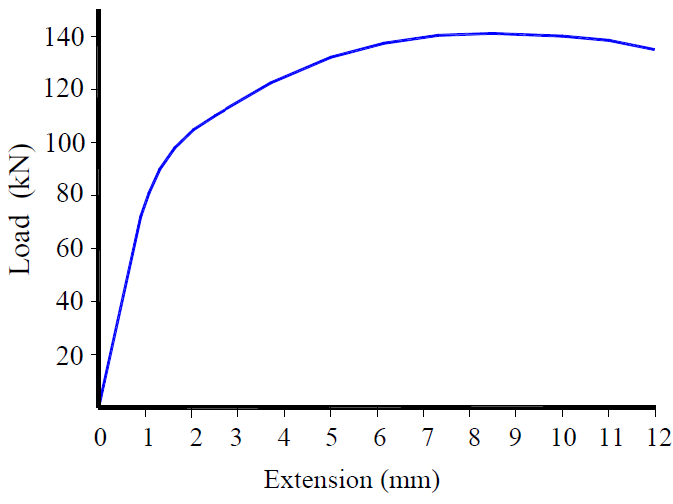
Load-extension graphs relate to the specific test piece being examined. Since test specimens can vary in size and dimensions, engineers need to create more standardised graphs to compare different materials effectively.
Load-extension graphs are specimen-specific and cannot be used to directly compare different materials. This is because larger specimens will naturally show higher loads and extensions than smaller ones, even if made from the same material.
Stress-strain graphs and material behaviour
To create standardised comparisons, engineers convert load-extension data into stress-strain graphs. These graphs allow direct comparison between different materials regardless of specimen size.
Stress is calculated by dividing the applied force by the cross-sectional area of the specimen. Stress is measured in units of N/mm² or kN/mm².
Strain is calculated by dividing the extension by the original length of the specimen. Strain has no units because it represents a ratio comparing the material's deformation to its original dimensions.
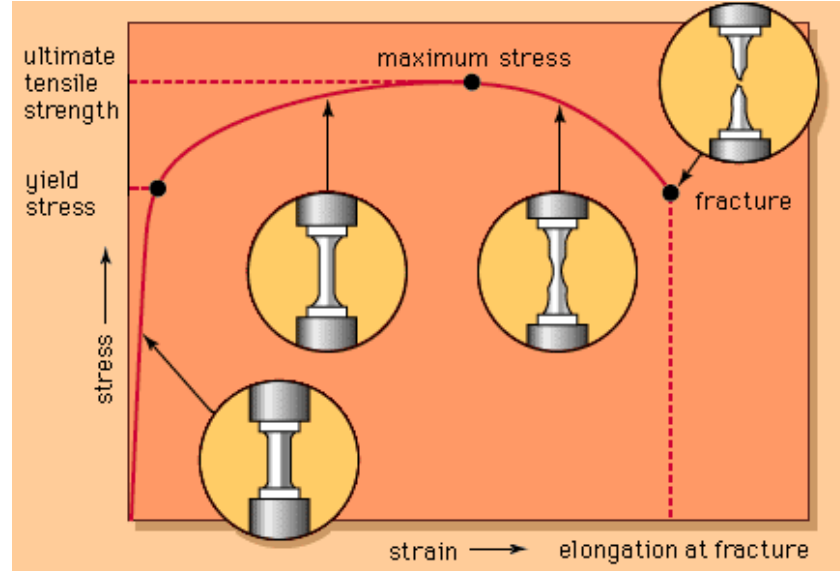
When a tensile test begins, the material initially experiences elastic deformation. During this phase, if the applied force is removed, the material will spring back to its original length. This behaviour continues until the material reaches its yield point.
Beyond the yield point, the material enters plastic deformation. During this phase, even if the force is removed, the material will not return to its original length - the deformation becomes permanent.
The transition from elastic to plastic deformation is critical for engineering applications. In most structural applications, engineers must ensure that loads never exceed the yield point to prevent permanent deformation.
The highest point on the stress-strain graph represents the ultimate tensile strength or maximum stress the material can withstand. After reaching this peak, the material begins to neck - it becomes thinner at a single weak spot as stretching continues. This necking process significantly weakens the material and ultimately leads to fracture.
Types of fracture
Materials display different fracture patterns depending on their properties:
Ductile materials typically show cup and cone fracture due to their ability to deform significantly before breaking. The fracture surface has a characteristic cup and cone appearance.
Brittle materials display brittle fracture with clean, flat fracture surfaces. These materials break suddenly with little deformation.
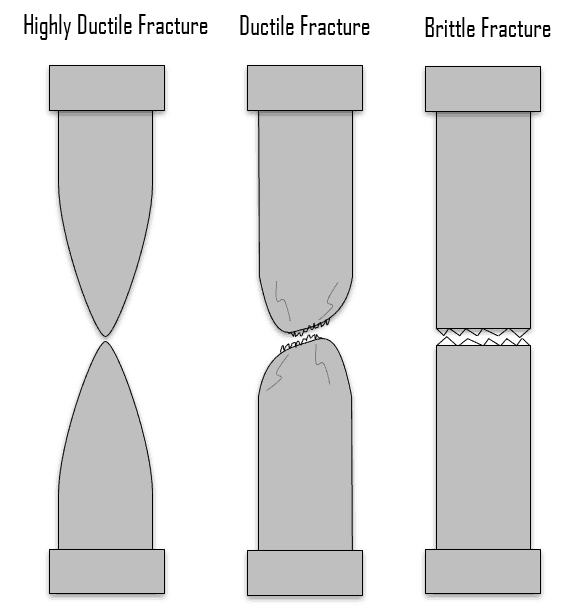
Understanding fracture patterns helps engineers predict how materials will behave in service. Ductile fracture gives warning signs through visible deformation, while brittle fracture can occur suddenly without warning, making it more dangerous in structural applications.
Key Points to Remember:
- Tensile testing determines the maximum force a material can withstand before breaking (Ultimate Tensile Strength)
- Load-extension graphs show raw test data, while stress-strain graphs allow standardised material comparisons
- Materials first deform elastically (recoverable), then plastically (permanent), before necking and finally fracturing
- Different materials show different fracture patterns - ductile materials show cup and cone fracture, while brittle materials show clean, flat breaks