Measuring and Predicting Earthquakes (Leaving Cert Geography): Revision Notes
Measuring and Predicting Earthquakes
Understanding when and where earthquakes might occur is crucial for protecting lives and property. Scientists have developed sophisticated methods to measure earthquake activity and attempt to predict future events, though prediction remains one of geology's greatest challenges.
Measuring earthquakes
Seismographs and seismometers
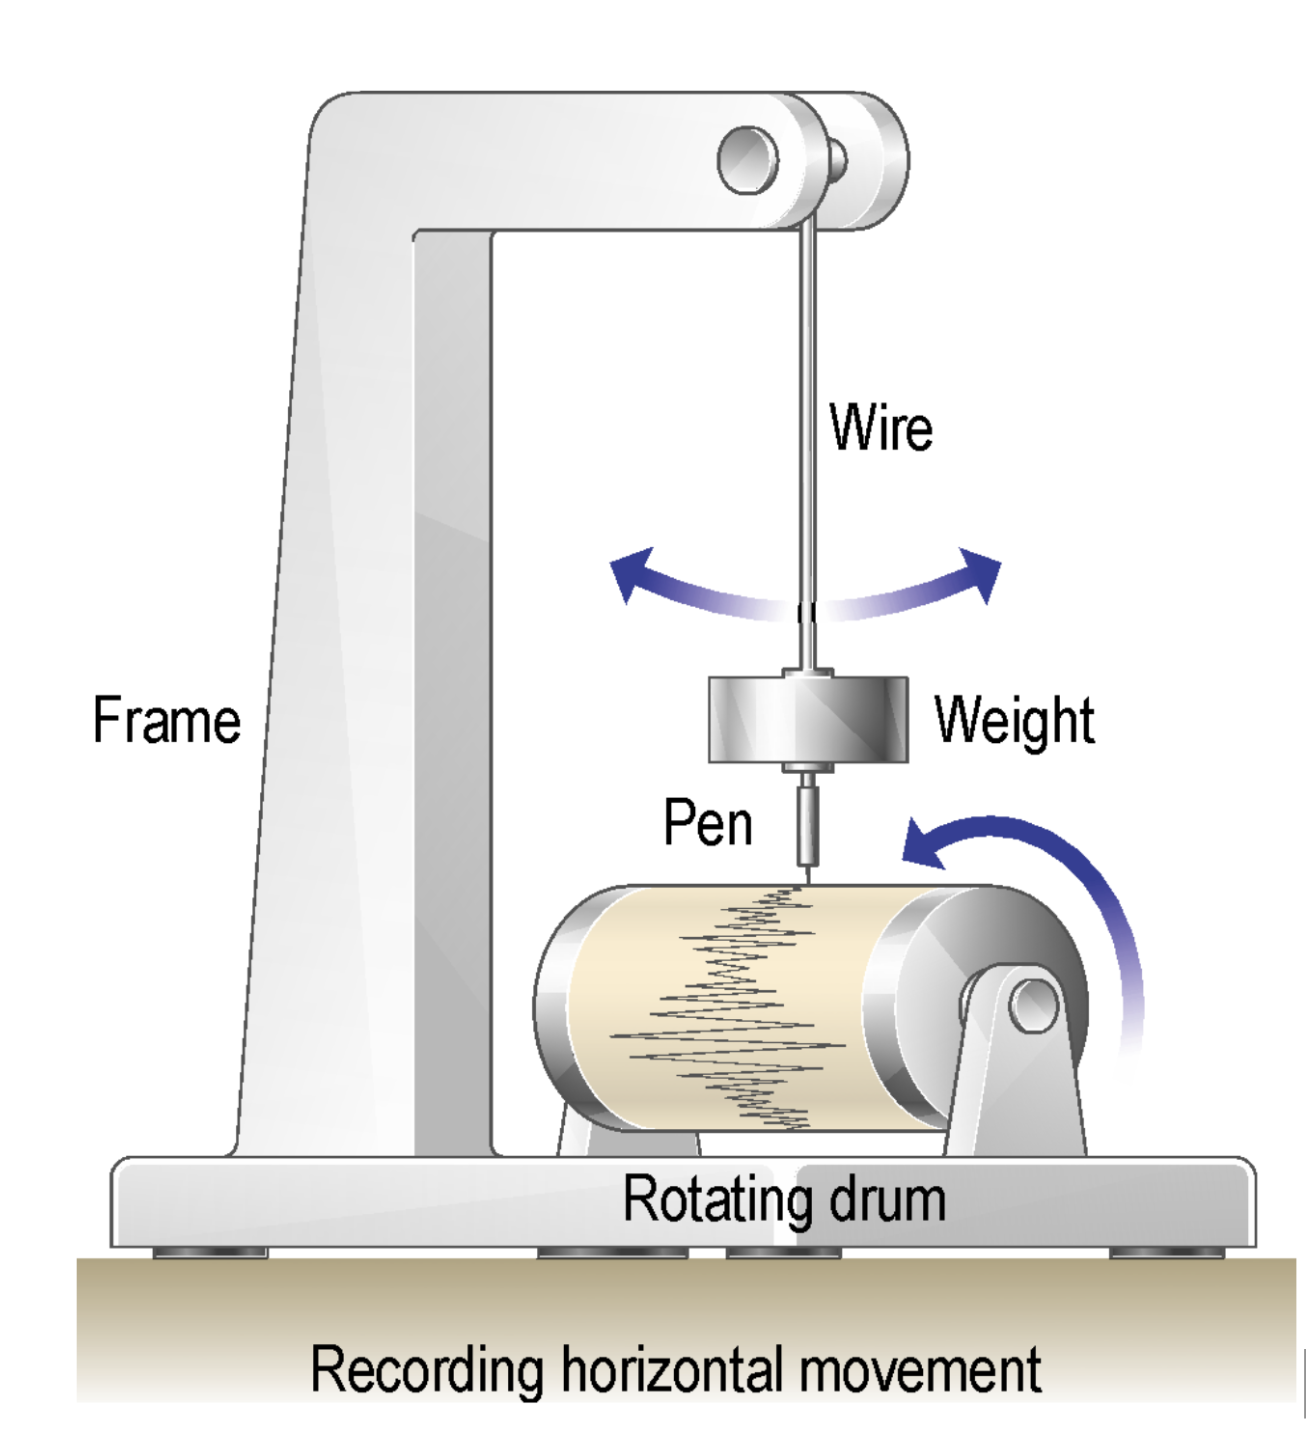
Scientists use specialised instruments to detect and record earthquake activity. Seismographs (also called seismometers) are sensitive devices that detect ground movements caused by seismic waves.
Seismograph: An instrument that records movements in the Earth's crust and detects earthquakes. These devices can record both vertical and horizontal ground movement, allowing scientists to create detailed graphs of seismic activity.
Seismographs are strategically placed along fault lines where earthquakes are most likely to occur. When an earthquake happens, the instrument records the different types of seismic waves as they arrive. Scientists can determine the earthquake's location and strength by analysing which seismograph recorded the strongest tremors and which began recording first.
Types of seismic waves
Earthquakes generate three main types of seismic waves, each travelling at different speeds:
- Primary waves (P-waves): The fastest-moving seismic waves that arrive first at monitoring stations. These waves can travel through solid rock, liquids, and gases
- Secondary waves (S-waves): The second waves to arrive, travelling at medium speeds. These waves can only move through solid rock and cause the ground to move perpendicular to the wave's direction
- Surface waves: The slowest-moving waves that travel along the Earth's surface like ripples on water. These waves cause most of the damage during earthquakes
Earthquake measurement scales
Scientists use three main scales to measure and describe earthquakes, each serving different purposes:
Richter scale
Developed by Charles Richter in 1935, this scale measures the magnitude (size) of earthquakes using seismograph readings.
Richter scale: A logarithmic scale that measures earthquake magnitude. Each whole number increase represents a tenfold increase in energy released. For example, a magnitude 7.0 earthquake is ten times stronger than a 6.0, and one million times stronger than a 1.0.
Key features of the Richter scale:
- Begins at 0 with no upper limit
- Highest magnitude ever recorded was 9.5 (Chile, 1960)
- Each step represents a tenfold increase in energy
- Earthquakes of magnitude 7.0 or greater are considered major events
Worked Example: Understanding Richter Scale Energy
If a magnitude 6.0 earthquake releases a certain amount of energy:
- A magnitude 7.0 earthquake releases 10× more energy
- A magnitude 8.0 earthquake releases 100× more energy
- A magnitude 9.0 earthquake releases 1,000× more energy
This exponential increase explains why even small increases in magnitude represent dramatically more destructive potential.
Moment magnitude scale (MMS)
Most seismologists now prefer the moment magnitude scale, which provides more accurate measurements than the Richter scale for larger earthquakes.
Moment magnitude scale (MMS): A more accurate scale that combines seismograph readings with measurements of actual rock movement at the fault. Media reports typically use MMS readings when reporting earthquake magnitudes.
The MMS is considered more reliable because it accounts for the physical displacement of rock along fault lines, not just the energy detected by seismographs.
Modified Mercalli scale
This older scale takes a completely different approach to measuring earthquake strength.
Modified Mercalli scale: A subjective scale that measures earthquake intensity based on observed damage and effects rather than scientific instruments. It uses Roman numerals from I (little to no damage) to XII (total destruction).
Important characteristics of the Mercalli scale:
- Based on visual observations of damage
- Uses 12 grades with Roman numerals
- Not connected to Richter or MMS readings
- A weak earthquake on scientific scales can still cause significant damage if it occurs close to populated areas with poor building standards
Predicting earthquakes
Despite enormous investment in research and technology, earthquake prediction remains extremely difficult and largely unsuccessful.
Why prediction is so challenging
The main difficulty lies in the large number of variables (factors that can change) involved in earthquake activity. Even when scientists identify potential warning signs in one area, these indicators prove unreliable when applied elsewhere because no two fault lines behave identically.
Critical Challenge: The enormous number of variables involved in earthquake activity makes prediction nearly impossible. What works as a warning sign in one location may be completely unreliable in another area due to unique geological conditions.
Methods used for earthquake prediction
Scientists employ three main approaches to attempt earthquake prediction, though none are universally accepted as accurate:
Animal behaviour
Some researchers believe that monitoring unusual animal behaviour might help predict earthquakes, particularly in countries like China.
Reported behaviours include:
- Rats fleeing from towns
- Animals coming out of hibernation early
- Cattle and sheep refusing to enter shelters
However, scientific evidence suggests animals cannot actually predict seismic activity. When animals do behave strangely before earthquakes, they are likely responding to primary waves (P-waves) that humans cannot detect. While this cannot predict earthquakes, it may provide a few valuable seconds of warning for people to take cover.
Common Misconception: Animals cannot truly predict earthquakes. Their unusual behaviour is simply a response to P-waves that arrive before the more destructive waves, providing only seconds of warning rather than days or weeks of prediction.
Historical records
Scientists study past earthquake patterns to estimate when future earthquakes might occur in specific areas.
This method involves:
- Analysing historical seismic activity data
- Identifying patterns or frequencies of earthquake activity
- Making long-term forecasts for future activity
Worked Example: Historical Pattern Analysis
If major earthquakes occur along the San Andreas Fault every 100 years on average:
- Scientists might estimate a 10% chance of occurrence in any given decade
- A 50% chance within 50 years
- Nearly 100% certainty within 150 years
However, this approach has significant limitations because geological conditions constantly change.
For example, if major earthquakes occur along a particular fault every 100 years, scientists might estimate a 10% chance of occurrence in any given decade. However, this approach is unreliable because plate movements constantly change fault characteristics, making historical patterns less relevant over time.
Measuring rock stress
This approach is considered the most reliable method for earthquake prediction and involves monitoring stress levels building up along fault lines.
Rock stress monitoring: The most dependable prediction technique, which uses various instruments to detect increasing pressure along fault lines. As stress builds, the likelihood of a strong earthquake increases.
Scientists use several instruments for this purpose:
- Strainmeters: Devices that monitor stress build-up at fault lines. Since rocks can only withstand certain pressures before breaking, these instruments help predict when breaking points might be reached
- Tiltmeters: Instruments that detect changes in land slope levels, indicating increased underground pressure
- Satellite/GPS technology: Systems that monitor ground deformation over large areas
- Seismographs: Used to detect foreshocks - small vibrations that often occur before main earthquakes
Worked Example: San Andreas Fault Monitoring
Scientists monitoring the San Andreas Fault have observed:
- Increasing stress measurements over decades
- Changes in ground elevation detected by GPS
- Patterns of small foreshocks
- Historical data showing major earthquakes every 150-200 years
Based on this comprehensive monitoring, scientists predict the next major earthquake will likely occur by 2032, though the exact timing remains uncertain.
Limitations of earthquake prediction
Despite these various methods, earthquake prediction remains highly unreliable. Current techniques primarily help scientists identify where earthquakes are likely to occur rather than precisely when they will happen. This geographical prediction is valuable for planning and preparation but cannot provide the specific timing that would allow for evacuation or immediate emergency response.
Key Points to Remember:
- Seismographs are essential instruments that detect and record earthquake activity by measuring ground movements along fault lines
- The Richter scale uses a logarithmic system where each whole number represents a tenfold increase in earthquake energy
- The moment magnitude scale (MMS) is now preferred by scientists as it combines seismograph data with actual rock displacement measurements
- Earthquake prediction remains extremely difficult due to the many variables involved and the unique characteristics of each fault line
- Rock stress monitoring is currently the most reliable prediction method, though it indicates location probability rather than precise timing