Speed, Distance, and Time (Leaving Cert Mathematics): Revision Notes
Speed, Distance, and Time
What are speed, distance, and time?
Speed is how fast something moves. It tells us the rate at which distance is covered over time. Distance is how far you travel from one point to another. Time is how long a journey takes.
These three quantities are closely connected through mathematical relationships that help us solve problems about movement and journeys.
Understanding the relationship between these three quantities is essential for solving any motion-related problem. Once you master these connections, you can tackle complex journey calculations with confidence.
The fundamental formulas
There are three key formulas that connect speed, distance, and time:
These three formulas are the foundation of all speed, distance, and time calculations. Memorising these relationships will help you solve any problem in this topic.
The triangle memory method
A helpful way to remember these formulas is using the triangle method. This visual aid makes it easy to find any missing value.
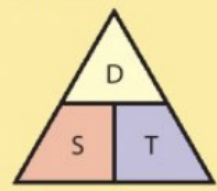
Using the Triangle Method:
To use this triangle:
- Cover the value you want to find with your thumb
- The remaining letters show you the calculation needed
- For example, to find speed, cover S and you see D over T (Distance ÷ Time)
This method is particularly useful during exams when you need to quickly recall the correct formula.
Understanding average speed
Average speed is the total distance travelled divided by the total time taken. This is different from instantaneous speed, which is your speed at any particular moment.
The formula for average speed is:
Worked Example: Calculating Average Speed
A motorist travels 500 kilometres in 6 hours. For the first two hours, her average speed was 100 km/hr. What was her average speed for the last four hours?
Step 1: Find distance travelled in first 2 hours Distance = Speed × Time = 100 × 2 = 200 km
Step 2: Find distance travelled in last 4 hours
Remaining distance = 500 - 200 = 300 km
Step 3: Calculate average speed for last 4 hours Average speed = Distance ÷ Time = 300 ÷ 4 = 75 km/hr
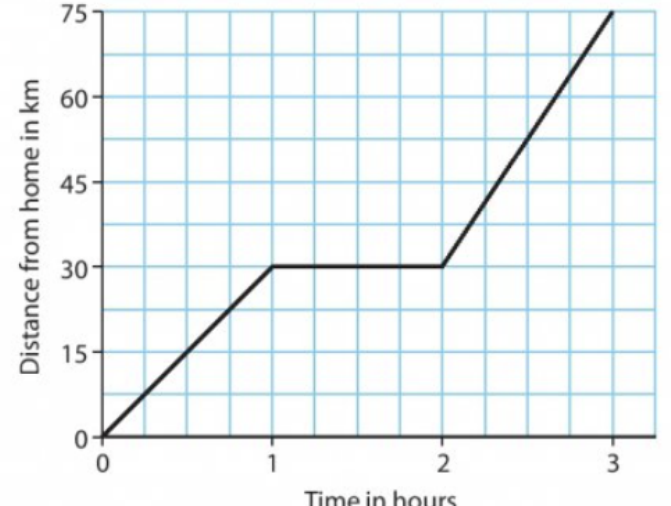
Distance-time graphs
Distance-time graphs are visual representations that show how distance changes over time during a journey. They provide valuable information about movement patterns.
Reading distance-time graphs
When interpreting these graphs, understanding the different line types is key to success:
Graph Interpretation Guide:
- Slanted lines represent steady movement at constant speed
- Horizontal lines represent rest periods (no movement)
- Steep slopes indicate faster speeds
- Gentle slopes indicate slower speeds
The steeper the line, the faster the movement. A completely flat line means the object is stationary.
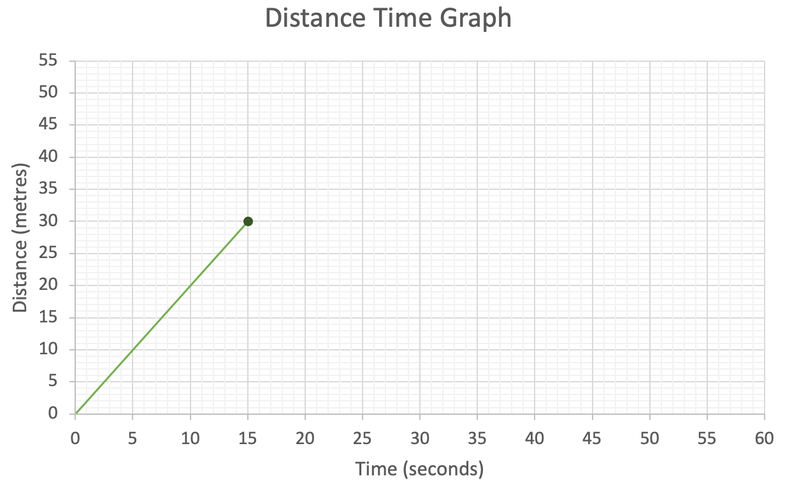
Calculating speed from graphs
To find speed from a distance-time graph, use the formula:
For example, if a section of the graph shows movement from 20 km to 60 km over 0.5 hours: Speed = (60 - 20) ÷ 0.5 = 40 ÷ 0.5 = 80 km/hr
When calculating speed from graphs, always identify the start and end points of the section you're analysing. Remember to subtract the initial distance from the final distance to get the distance travelled.
Real-world applications
Journey planning example

When planning journeys with multiple stops, you can calculate speeds for different segments. Understanding how to break down complex journeys into manageable parts is essential for real-world applications.
Worked Example: Multi-Stage Journey
For a journey from Dublin to Limerick to Tralee:
- Dublin to Limerick: 190 km in 2.5 hours = 76 km/hr
- Limerick to Tralee: 120 km in 2.25 hours = 53 km/hr
- Overall journey: 310 km in 4.75 hours = 65 km/hr
Notice how the overall average speed is different from the individual segment speeds.
Complex journey analysis
More complex graphs can show journeys with multiple phases, including periods of rest and different speeds. These require careful analysis of each segment separately.
When analysing complex journeys, break the graph into segments and calculate the speed for each part individually. This makes even the most complicated journey manageable.
Common exam tips
Understanding these key strategies will help you succeed in examinations:
Essential Exam Tips:
- Units matter - Always check that your units are consistent (km/hr, m/s, etc.)
- Read graphs carefully - Identify what each axis represents before calculating
- Show your working - Break complex problems into clear steps
- Check your answers - Do your results make practical sense?
These strategies will help you avoid common mistakes and maximise your marks.
Worked example: graph interpretation
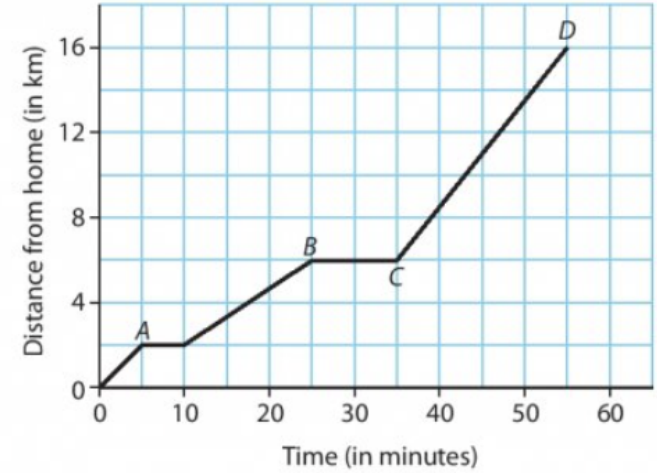
Looking at a distance-time graph with labelled points requires systematic analysis:
Worked Example: Graph Analysis
Looking at a distance-time graph with labelled points:
- From A to B: gradual movement away from home
- From B to C: constant distance (rest period)
- From C to D: rapid movement to final destination
Each segment can be analysed separately to find speeds and understand the journey pattern. The key is to identify each phase and calculate speeds systematically.
Key Points to Remember:
- Speed = Distance ÷ Time - Use this relationship to solve most problems
- The triangle method helps you remember which formula to use
- Horizontal lines on graphs mean no movement (rest periods)
- Steeper slopes on graphs indicate faster speeds
- Average speed uses total distance and total time, not instantaneous values
Master these fundamentals and you'll be able to tackle any speed, distance, and time problem with confidence!