Linear (Leaving Cert Mathematics): Revision Notes
Linear
Now we will draw our attention to different categories of graphs, the first being linear graphs that take the shape of a line. The general form of a linear function is :
Linear functions represent linear relationships between an input and an output .
- is the slope of the line (how steep it is).
- is the -intercept (the point where the graph crosses the -axis).
The slope can also be found using rise over run or using the slope formula by taking any two points that satisfy the function.
Example
Find the equation of the function given the following graph.
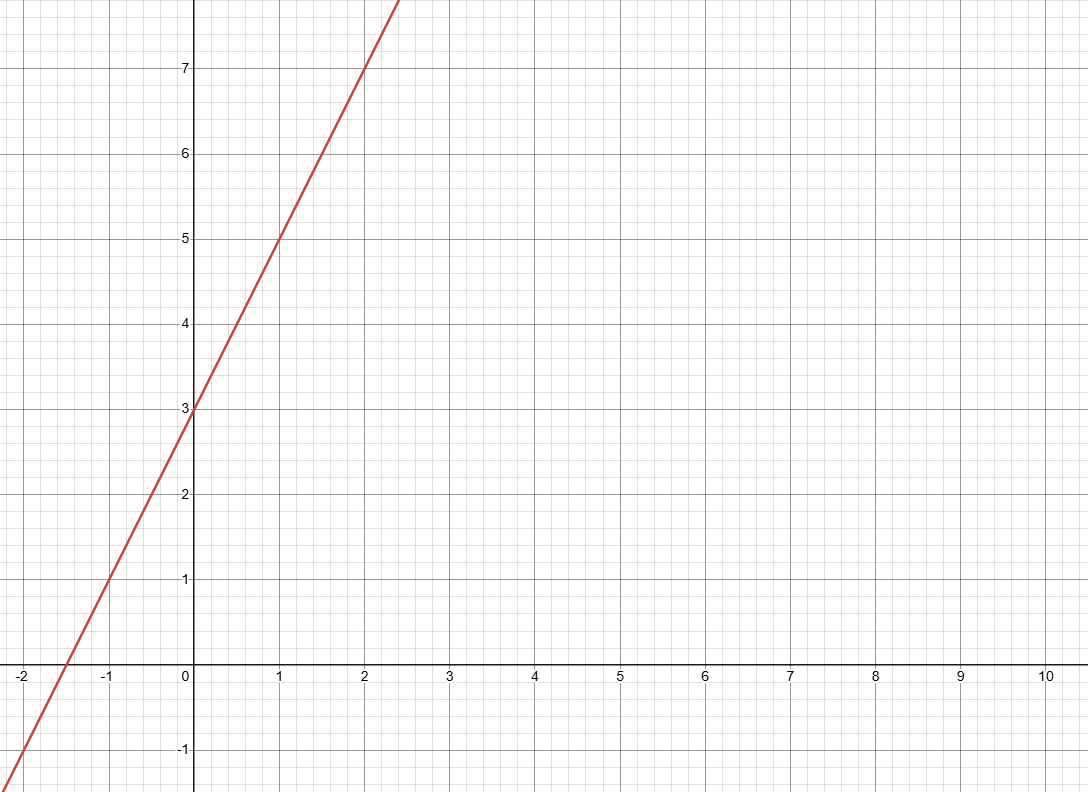
Finding the equation of a linear function is the exact same as finding the equation of a line, all we need is one coordinate on the line and the slope.
Pick any two coordinates - whole numbers preferably. We can see that the points and lie on the line, which we can use in the slope formula.
Alternatively, we can use the rise over run, take any vertical distance, and its corresponding horizontal distance to form a triangle.
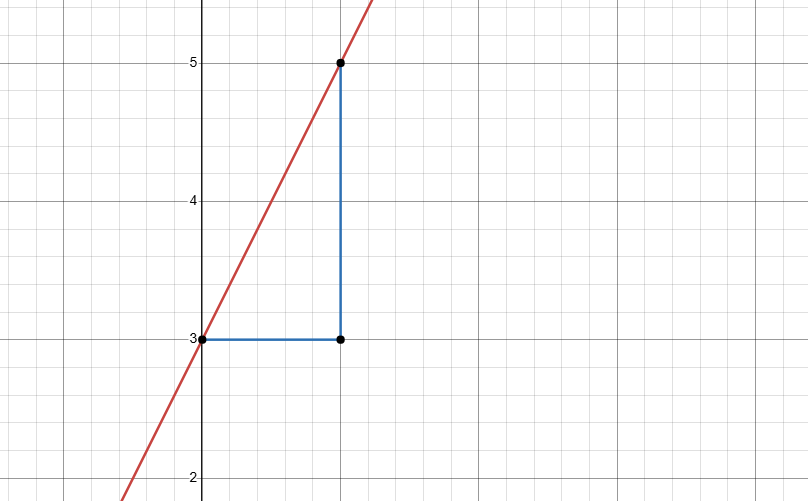
The vertical distance is and the horizontal distance is .
Now we have a slope, and also a point on the line - let's use . Now use the equation of the line formula to derive the equation of the line.
Finally, convert to function notation :
Notice the way that and are usually interchangeable. They usually mean the same thing - loosely speaking.
Is the same thing as :
Now let's consider some real life linear relationships :
- A job pays a base pay of €100 per day. The job involves selling computers at an electronics store, where every computer sold earns the employee €15 commission. Now let's express the employee's daily pay as a function :
- is the employees pay which is represented as a function that takes in computers sold.
- If the employee sold zero computers that day , then they just get their base pay.
- For every computers sold, the total pay increases €15 for each computer.
- As increases, so does - the more computers an employee sells, the more pay they get. We say there is a positive relationship between the pay and the number of computers sold.
- The demand for a product decreases as the price increases. If the product is sold at €10 euro, there is a demand of 100 units. If it increases to €20, there is a demand of 50 items.
- If we do the calculation in the same way as in the first example - using points and , the demand function is given by :
- If the price increases, the demand decreases, hence, we say there is a negative relationship between these two variables.