The Normal Distribution and the Empirical Rule (Leaving Cert Mathematics): Revision Notes
The Normal Distribution and the Empirical Rule
What is a normal distribution?
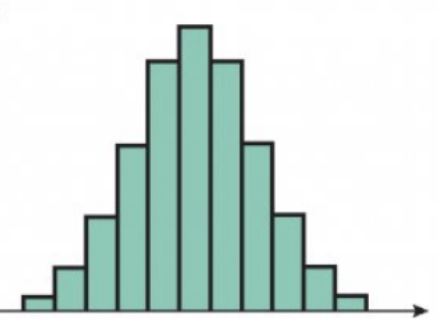
A normal distribution appears when we collect data about physical characteristics like height or weight from large groups of people. When we arrange this data from lowest to highest values in a frequency distribution, we notice a consistent pattern emerges.
Most values cluster around the middle of the distribution, creating a symmetrical pattern. This forms what we call a bell-shaped histogram.
The normal distribution is one of the most important probability distributions in statistics because it naturally occurs in many real-world scenarios involving large datasets.
From histogram to normal curve
When we have a very large amount of continuous data and make our class intervals sufficiently small, the histogram transforms into a smooth, symmetrical curve. This smooth curve is called the curve of normal distribution or simply the normal curve.
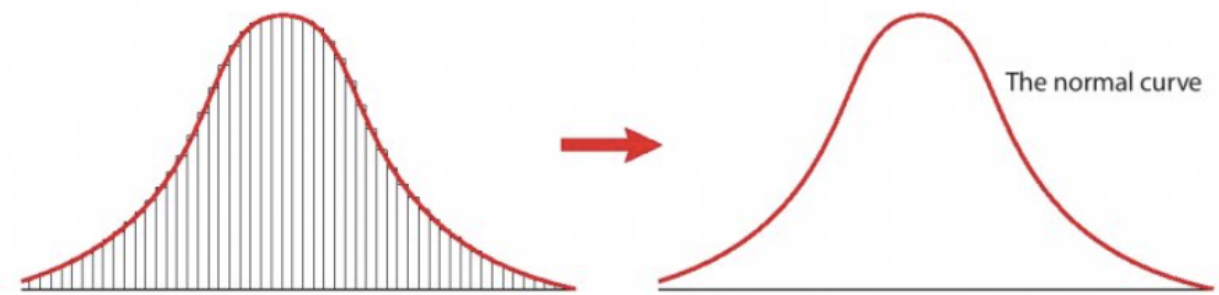
The normal curve is perfectly symmetrical and bell-shaped. It represents the theoretical ideal of how normally distributed data should look when we have infinite data points.
Understanding standard deviation
Standard deviation (represented by the symbol ) measures how spread out our data is from the mean. It tells us the typical distance that data points are from the average value. This concept is crucial for understanding the empirical rule.
The empirical rule
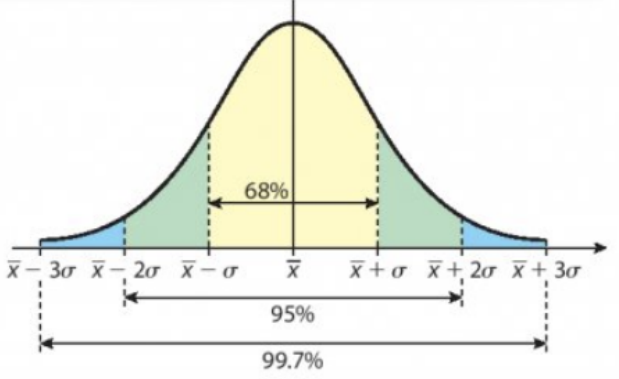
There is a very important relationship between the normal curve and standard deviations, known as the Empirical Rule. This rule gives us specific percentages for how data is distributed around the mean.
The Empirical Rule states:
For any large population with mean and standard deviation :
- 68% of values lie within one standard deviation of the mean (between and )
- 95% of values lie within two standard deviations of the mean (between and )
- 99.7% of values lie within three standard deviations of the mean (between and )
This means that if we pick a value at random from a normal distribution, there's a 68% chance (or 0.68 probability) it will fall within one standard deviation of the mean.
Worked example 1: Finding values and probabilities
Worked Example: Calculating Standard Deviation Ranges
Given: A normal distribution has mean and standard deviation .
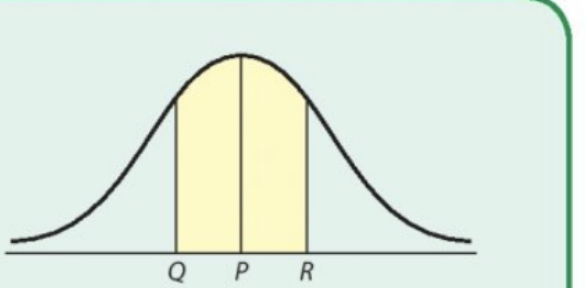
In this diagram, P represents the mean, Q represents one standard deviation below the mean, and R represents one standard deviation above the mean.
Step 1: Find the values of P, Q and R
- P = 80 (the mean)
- Q =
- R =
Step 2: Identify what the shaded area represents
The shaded area shows all values within one standard deviation of the mean. According to the empirical rule, this contains 68% of the data.
Step 3: Find the probability
If we select a value at random, the probability it comes from the shaded area = 68% = 0.68.
Worked example 2: Applying the empirical rule
Worked Example: Finding Different Percentage Ranges
Given: A normal distribution has mean and standard deviation .
Find:
(i) The range containing 68% of the distribution
(ii) The range containing 95% of the distribution
(iii) What percentage lies within 3 standard deviations
Solution:
(i) 68% range: to
- Therefore, 68% lies in the range [40, 50]
(ii) 95% range: to
- Therefore, 95% lies in the range [35, 55]
(iii) Three standard deviations: According to the empirical rule, 99.7% of the distribution lies within 3 standard deviations of the mean.
Worked example 3: Finding standard deviation
Worked Example: Reverse Calculation for Standard Deviation
Given: The mean of a normal distribution is 84. If 95% of values are between 72 and 96, find the standard deviation .
Solution:
By the empirical rule, 95% of values lie in the range
Since the given range is [72, 96], we have:
This gives us:
Substituting :
Therefore, the standard deviation is 6.
Visual representations
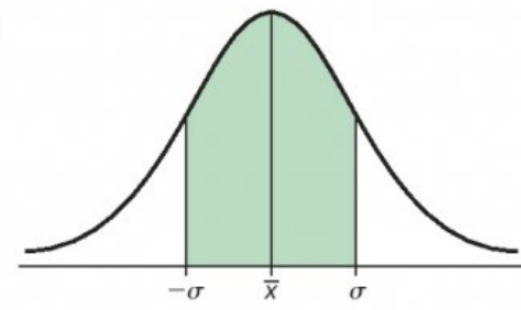
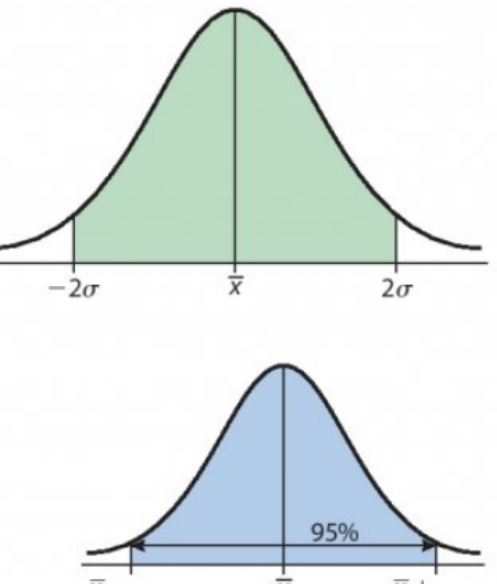
These diagrams illustrate how the empirical rule divides the normal curve into regions. The first shows the area within one standard deviation (68% of the data), while the second shows both standard deviation markings and the 95% confidence interval area.
Key formulas to remember
Essential Formulas for Normal Distribution:
For a normal distribution with mean and standard deviation :
- 68% range:
- 95% range:
- 99.7% range:
Exam tips
Important Exam Strategies:
- Always identify the mean and standard deviation first
- Remember the 68-95-99.7 percentages - these are essential
- When finding ranges, subtract and add the appropriate number of standard deviations from the mean
- Convert percentages to probabilities by dividing by 100 (e.g., 68% = 0.68)
- Check your arithmetic carefully when calculating ranges
Key Points to Remember:
- Normal distribution creates a bell-shaped, symmetrical curve
- The empirical rule gives us the 68-95-99.7 percentages for data within 1, 2, and 3 standard deviations
- 68% of data lies within one standard deviation of the mean
- 95% of data lies within two standard deviations of the mean
- 99.7% of data lies within three standard deviations of the mean
- These percentages are the foundation for solving normal distribution problems in exams