Grouped Frequency Distributions (Leaving Cert Mathematics): Revision Notes
Grouped Frequency Distributions
What are grouped frequency distributions?
When working with large amounts of data, it becomes impractical to list every individual value. Grouped frequency distributions organise data into classes or groups to make analysis more manageable.
For example, instead of recording each person's exact age, we might group ages into ranges like 0-9 years, 10-19 years, and so on. This approach is particularly useful when dealing with continuous data or large datasets.
Grouped frequency distributions are especially valuable when:
- You have more than 20-30 data points
- The data spans a wide range of values
- You want to identify general patterns rather than specific values
- The data is continuous (like heights, weights, or time measurements)
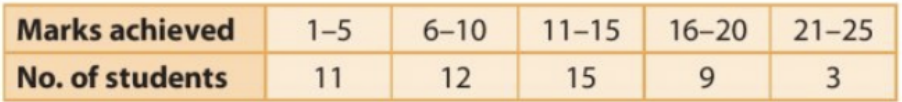
The table above shows how student test marks can be grouped into class intervals, making it easier to see patterns in the data.
Finding the mean of grouped data
Mid-interval values
Since we don't know the exact values within each class, we use the mid-interval value (also called the class midpoint) to represent each group.
Mid-interval value formula:
For example:
- Class 1-5: Mid-interval value =
- Class 6-10: Mid-interval value =
Mean formula for grouped data
Mean formula for grouped data:
Where:
- f = frequency of each class
- x = mid-interval value of each class
- Σfx = sum of (frequency × mid-interval value) for all classes
- Σf = total frequency
Worked example: calculating the mean
Worked Example: Calculating the Mean from Grouped Data
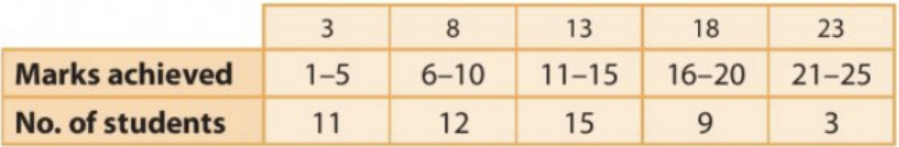
Using the student marks data:
| Class | Mid-interval (x) | Frequency (f) | fx |
|---|---|---|---|
| 1-5 | 3 | 11 | 33 |
| 6-10 | 8 | 12 | 96 |
| 11-15 | 13 | 15 | 195 |
| 16-20 | 18 | 9 | 162 |
| 21-25 | 23 | 3 | 69 |
| Totals | 50 | 555 |
Step 1: Calculate mid-interval values for each class
Step 2: Multiply each mid-interval value by its frequency (fx)
Step 3: Sum all fx values:
Step 4: Sum all frequencies:
Step 5: Apply the formula:
The estimated mean mark is 11.1 out of 25.
Finding the mode and median in grouped data
Modal class
For grouped data, we cannot find an exact mode. Instead, we identify the modal class - the class interval with the highest frequency.
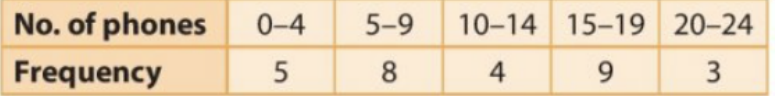
In this phone sales data, the modal class is 15-19 phones because it has the highest frequency (9).
Median class
We cannot find an exact median value from grouped data, but we can identify the median class - the class interval containing the median position.
Steps to find the median class:
- Calculate the total frequency (n)
- Find the median position =
- Count cumulative frequencies until you reach the median position
- The class containing this position is the median class
Worked Example: Finding the Median Class
Using the phone sales data:
| Class | Frequency | Cumulative frequency |
|---|---|---|
| 0-4 | 5 | 5 |
| 5-9 | 8 | 13 |
| 10-14 | 4 | 17 |
| 15-19 | 9 | 26 |
| 20-24 | 3 | 29 |
Step 1: Total frequency = 29
Step 2: Median position = th value
Step 3: Build cumulative frequency column
Step 4: The 15th value lies in the 10-14 class (since cumulative frequency reaches 17 at this class)
Therefore, the median class is 10-14 phones.
Worked example: complete analysis
Worked Example: Complete Statistical Analysis
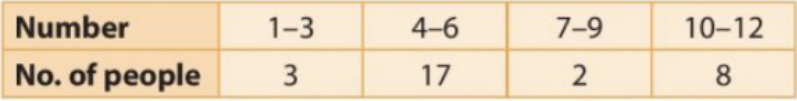
Let's analyse this data showing number ranges and people:
Finding the modal class: The class 4-6 has the highest frequency (17), so this is the modal class.
Finding the mean:
| Class | Mid-interval (x) | Frequency (f) | fx |
|---|---|---|---|
| 1-3 | 2 | 3 | 6 |
| 4-6 | 5 | 17 | 85 |
| 7-9 | 8 | 2 | 16 |
| 10-12 | 11 | 8 | 88 |
| Totals | 30 | 195 |
Mean =
Finding the median class:
- Total frequency = 30
- Median position = th value
- Cumulative frequencies: 3, 20, 22, 30
- The 15.5th value lies in the 4-6 class
Exam Tips:
- Always use mid-interval values when calculating the mean for grouped data
- Remember that you can only identify modal and median classes, not exact values
- Check your arithmetic carefully - errors in calculations are common
- Show all working clearly, including the mid-interval value calculations
- Don't forget to divide by the total frequency when finding the mean
Key Points to Remember:
- Grouped data organises large datasets into class intervals for easier analysis
- Use mid-interval values to represent each class when calculating statistics
- Mean formula: where x = mid-interval value and f = frequency
- Modal class is the interval with the highest frequency
- Median class contains the middle value position, found using cumulative frequencies