Causal Relationships and Correlation (Leaving Cert Mathematics): Revision Notes
Causal Relationships and Correlation
What is a causal relationship?
A causal relationship exists when a change in one variable directly causes a change in another variable. This means that one factor is responsible for producing the effect seen in another factor.
For example, the price of a used car depends on many factors, including the age of the car. As a car gets older, its price typically decreases. Here, the age of the car causes the price to change, creating a causal relationship between these two variables.
Key Definition: When a change in one variable causes a change in another variable, there is a causal relationship between them.
Understanding correlation vs causation
What is correlation?
Correlation describes how two variables move together. When we see a pattern between two sets of data on a scatter plot, we can describe the correlation as:
- Positive correlation: as one variable increases, the other also increases
- Negative correlation: as one variable increases, the other decreases
- Strong correlation: the points lie close to a straight line pattern
- Weak correlation: the points are more scattered but still show a general pattern
The key difference
The most important principle to understand is: correlation does not necessarily mean causation.
Just because two variables show a correlation doesn't mean that one causes the other. There might be other factors at play, or the relationship might be purely coincidental.
Examples of causal relationships
Temperature and iced drink sales
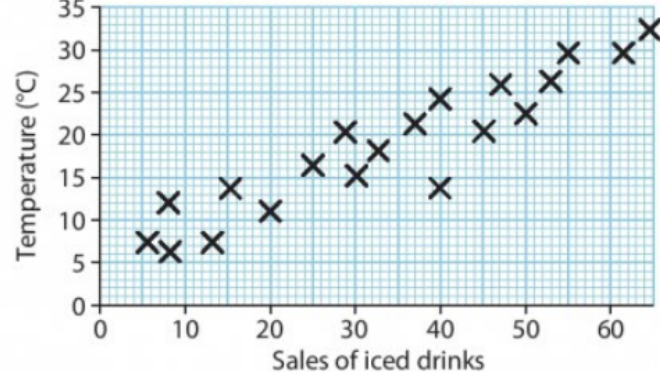
This scatter graph demonstrates a clear causal relationship. As temperature increases, sales of iced drinks also increase. This makes logical sense because:
- Higher temperatures make people feel hotter
- When people feel hot, they want cold drinks to cool down
- Therefore, temperature directly causes increased demand for iced drinks
The correlation here is both strong and positive, and we can reasonably conclude there is a causal relationship because the connection is logical and direct.
Examples of correlation without causation
Laptop and fridge sales
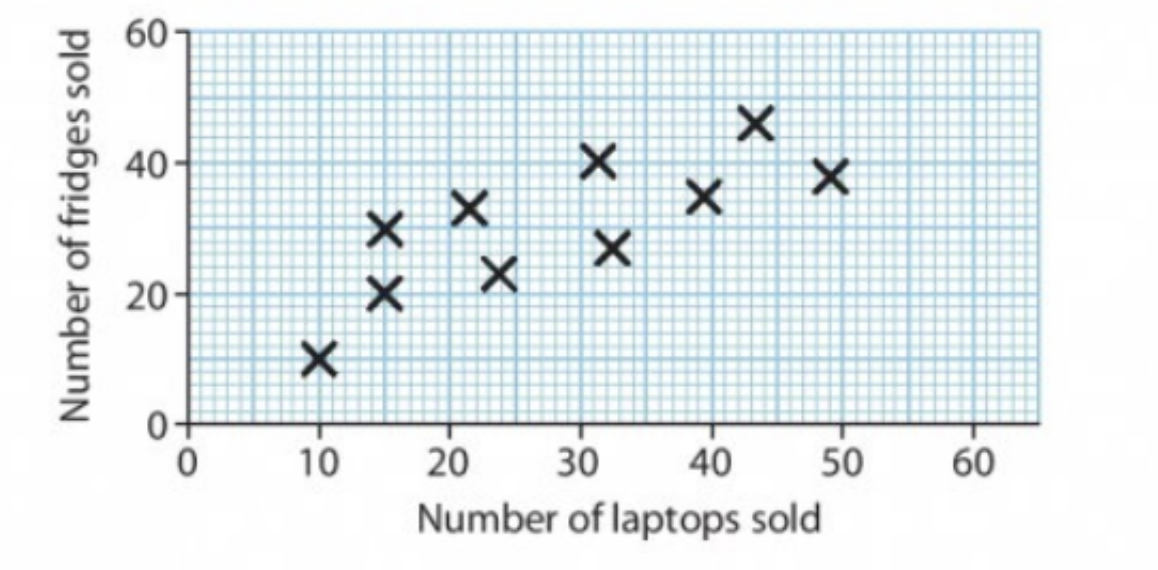
This scatter graph shows a reasonably strong positive correlation between laptop sales and fridge sales at an electrical shop over a ten-month period. However, this correlation does not indicate a causal relationship because:
- Buying a laptop does not cause someone to buy a fridge
- There's no logical connection between these purchases
- The correlation is likely due to other factors (seasonal sales, economic conditions, marketing campaigns, etc.)
This example perfectly illustrates why we must be careful not to assume causation from correlation alone.
How to identify causal relationships
When examining scatter plots and correlations, ask yourself these questions:
- Does it make logical sense? Is there a reasonable explanation for why one variable would cause changes in the other?
- What other factors could be involved? Could there be hidden variables affecting both measurements?
- Is the relationship direct? Does changing one variable directly result in changes to the other?
- Can you explain the mechanism? Can you describe how the cause creates the effect?
Worked example: Age and distance travelled
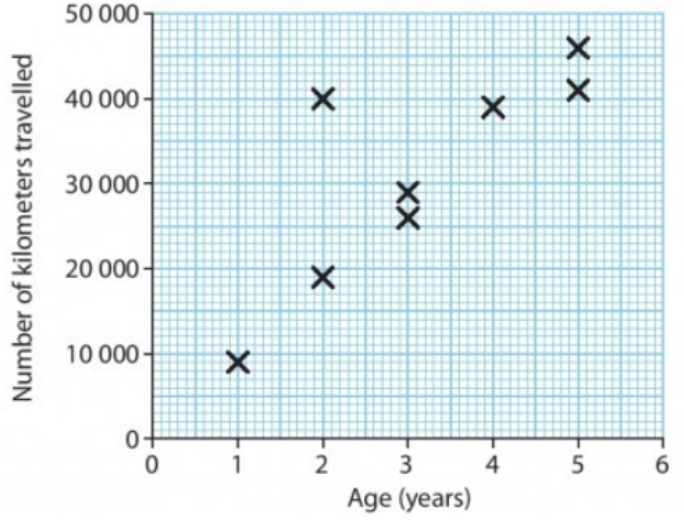
This scatter plot shows the relationship between a car's age (in years) and the total distance it has travelled (in kilometres).
Worked Example: Analysing Age and Distance Relationship
Analysis:
- The graph shows a positive correlation - older cars have travelled more kilometres
- This is likely a causal relationship because:
- Cars accumulate distance over time
- The longer a car exists, the more opportunity it has to be driven
- Age directly contributes to total distance travelled
Key insight: Time allows for distance to accumulate, making this a genuine cause-and-effect relationship.
Common exam traps
Watch Out For These Common Mistakes:
- Trap 1: Assuming all positive correlations indicate causation
- Trap 2: Forgetting to consider alternative explanations for correlations
- Trap 3: Not thinking logically about whether relationships make sense
- Exam tip: Always explain your reasoning when asked about causal relationships
Problem-solving method
When analysing scatter plots for causal relationships:
Step-by-Step Analysis Method:
- Describe the correlation (positive/negative, strong/weak)
- Consider the logical connection between variables
- Think of alternative explanations for the correlation
- State your conclusion with clear reasoning
- Use key phrases like "correlation does not necessarily mean causation"
Remember!
Key Points to Remember:
- Causal relationship means one variable directly causes changes in another variable
- Correlation simply means two variables move together in a pattern
- Correlation does not necessarily mean causation - this is the most important principle
- Always think logically about whether a cause-and-effect relationship makes sense
- Consider other possible explanations for observed correlations
- In exams, clearly explain your reasoning when determining if relationships are causal