Measuring Correlation (Leaving Cert Mathematics): Revision Notes
Measuring Correlation
What is correlation?
Correlation measures the strength and direction of the relationship between two variables. When we plot data points on a scatter graph, we can observe different patterns that tell us how closely the variables are related.
The strength of correlation is measured using the correlation coefficient, represented by the letter r. This value always falls between -1 and +1, and tells us exactly how strong the relationship is.
The correlation coefficient r provides a precise numerical measure of linear relationships. Values closer to +1 or -1 indicate stronger relationships, while values closer to 0 indicate weaker relationships.
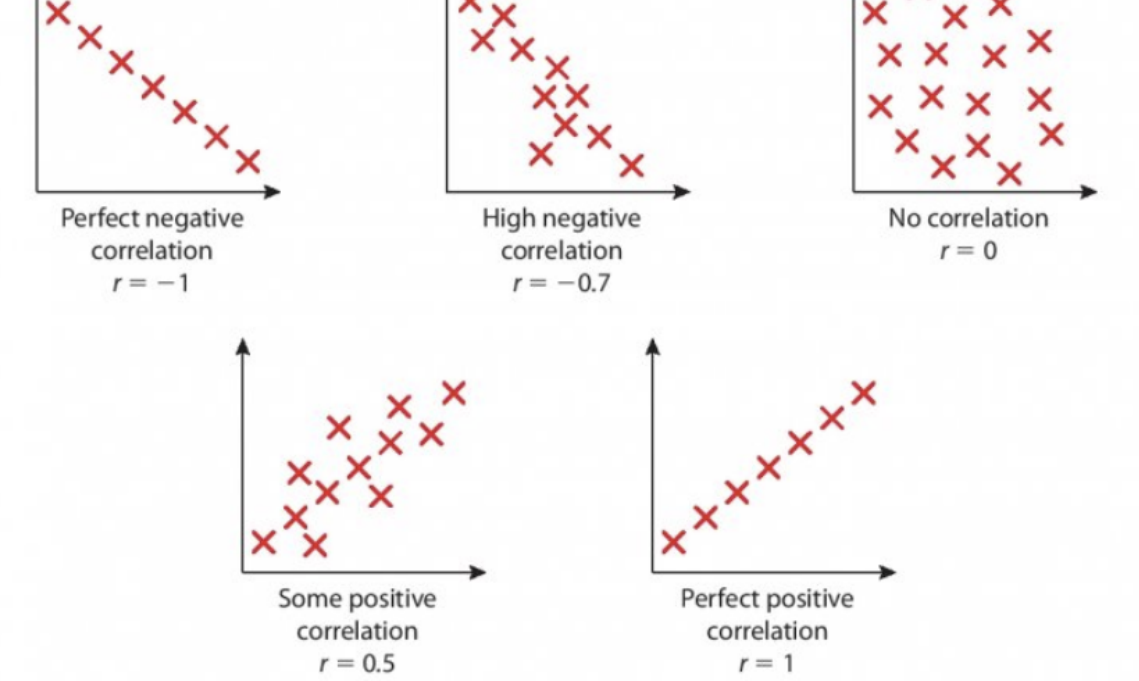
Types of correlation
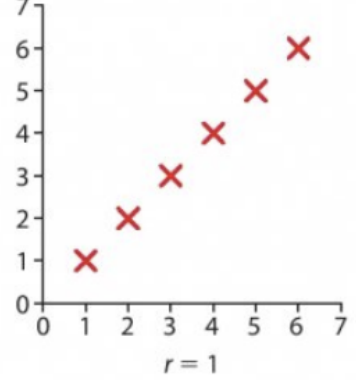
Perfect positive correlation (r = 1)
When points on a scatter plot form a perfect straight line going upwards from left to right, we have perfect positive correlation. This means:
- As one variable increases, the other increases in perfect proportion
- All data points lie exactly on a straight line
- The correlation coefficient r = 1
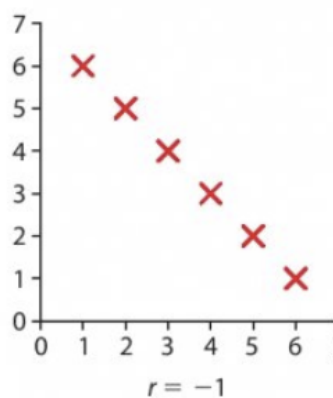
Perfect negative correlation (r = -1)
When points form a perfect straight line going downwards from left to right, we have perfect negative correlation. This means:
- As one variable increases, the other decreases in perfect proportion
- All data points lie exactly on a straight line (sloping downwards)
- The correlation coefficient r = -1
No correlation (r = 0)
When points are scattered randomly with no clear pattern, there is no correlation between the variables. This means:
- The variables are not related to each other
- Points appear randomly distributed
- The correlation coefficient r = 0
Perfect correlation (r = +1 or r = -1) is extremely rare in real-world data. Most correlations fall somewhere between these extremes.
Understanding correlation coefficient values
The correlation coefficient r can take any value between -1 and +1:
- r = 1: Perfect positive correlation
- r = -1: Perfect negative correlation
- r = 0: No correlation
- Values between 0 and 1: Positive correlation (stronger as r approaches 1)
- Values between -1 and 0: Negative correlation (stronger as r approaches -1)
Interpreting scatter plots
Understanding how to read scatter plots is essential for identifying correlation patterns. When examining scatter plots, look for these patterns:
Strong positive correlation (e.g., r = 0.9):
- Points roughly follow an upward trending line
- Most points are close to where a straight line would be drawn
Weak positive correlation (e.g., r = 0.5):
- Points show a loose upward trend
- More scatter around where a line would be
Strong negative correlation (e.g., r = -0.7):
- Points roughly follow a downward trending line
- Clear downward pattern visible
Weak negative correlation (e.g., r = -0.2):
- Slight downward trend
- Lots of scatter, pattern not very clear
The strength of correlation depends on how closely the points cluster around an imaginary straight line. The direction (positive or negative) depends on whether the line slopes upward or downward.
Worked Examples
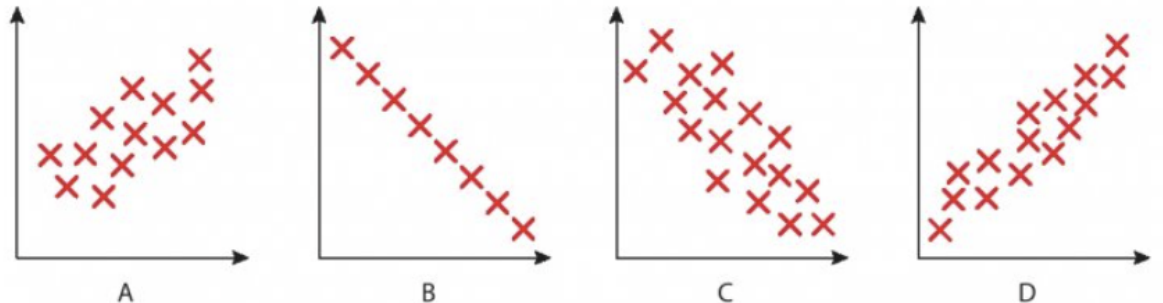
Worked Example 1: Matching scatter plots to correlation coefficients
Question: Match each scatter plot (A, B, C, D) with its most likely correlation coefficient from the list: 0.2, -0.8, -0.2, 0, 0.9, -0.6
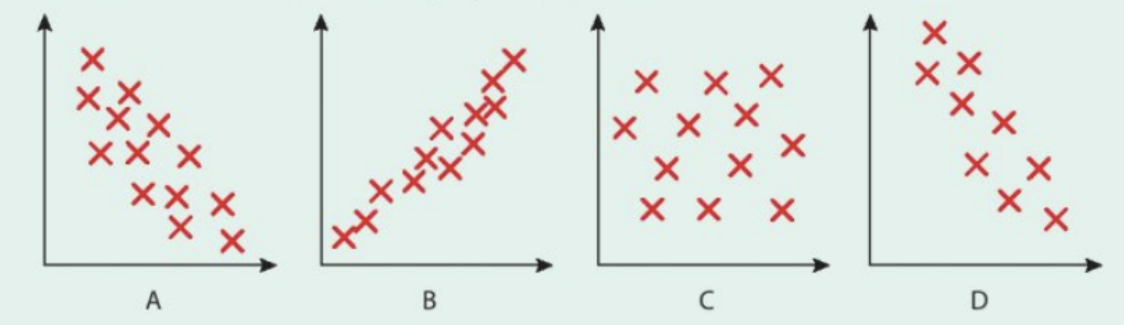
Solution:
- Plot A shows a moderate negative pattern → r = -0.6
- Plot B shows a strong positive pattern → r = 0.9
- Plot C shows random scatter → r = 0
- Plot D shows a strong negative pattern → r = -0.8
Method: Look at the direction (positive/negative) and strength (how close to a straight line) to determine the correlation coefficient.
Worked Example 2: Identifying correlation types
When looking at scatter plots, follow these steps:
- Determine direction: Does the pattern go up (positive) or down (negative) from left to right?
- Assess strength: How close are the points to forming a straight line?
- Choose appropriate r value: Strong correlations have values closer to 1 or -1, weak correlations are closer to 0
For curved relationships (like Plot D in the diagram), correlation coefficient may not be the best measure as it only detects linear relationships.
Common exam tips
Essential Exam Strategies:
- Perfect correlation only occurs when ALL points lie exactly on a straight line
- Strong correlation means most points are close to a straight line pattern
- Weak correlation shows a loose trend with lots of scatter
- Remember that correlation values are always between -1 and +1
- A correlation of 0 means no linear relationship (there might still be a curved relationship)
- Positive r values indicate both variables increase together
- Negative r values indicate one variable decreases as the other increases
Exam trap alerts
Critical Points to Avoid Common Mistakes:
Don't confuse strength with direction:
- r = -0.8 is a strong negative correlation
- r = 0.3 is a weak positive correlation
- The strength depends on how close r is to 1 or -1, not whether it's positive or negative
Remember that r = 0 doesn't mean no relationship exists - just no linear relationship
Look carefully at scatter plots - sometimes the pattern isn't immediately obvious and requires careful analysis
Key Points to Remember:
- Correlation coefficient (r) measures the strength and direction of linear relationships between two variables
- r always falls between -1 and +1, with values closer to these extremes indicating stronger correlations
- Perfect correlations (r = 1 or r = -1) only occur when all points lie exactly on a straight line
- No correlation (r = 0) means the points are scattered randomly with no clear linear pattern
- Positive correlations show both variables increasing together, while negative correlations show one decreasing as the other increases