Stem and Leaf Diagrams (Leaving Cert Mathematics): Revision Notes
Stem and Leaf Diagrams
What is a stem and leaf diagram?
A stem and leaf diagram is a useful way of organising and displaying numerical data. It shows all the original data values whilst giving you a clear picture of how the data is distributed. Think of it as similar to a horizontal bar chart, but using the actual numbers to form the bars.
The diagram works by splitting each number into two parts:
- The stem represents the tens digit (or higher place value)
- The leaf represents the units digit
For example, the number 42 would be shown as 4|2, where 4 is the stem and 2 is the leaf.
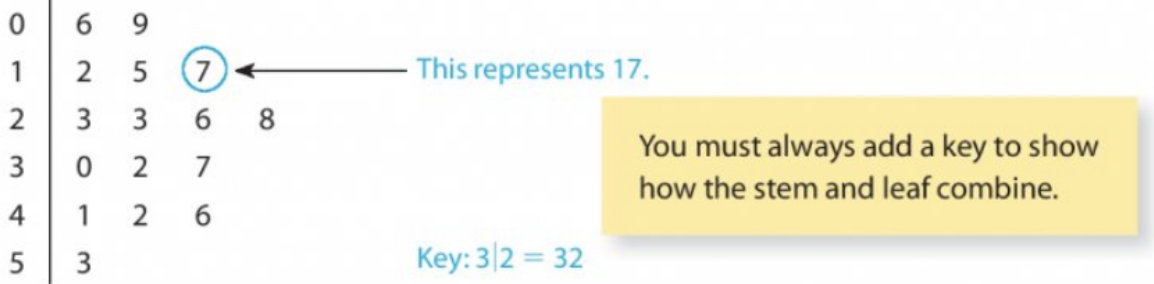
Key Requirement: You must always include a key to show how the stem and leaf combine. This tells anyone reading your diagram how to interpret the numbers.
Basic structure and construction
Creating a stem and leaf diagram follows a systematic approach that ensures your data is properly organised and easy to read.
Step 1: Identify the range
Look at your data to find the smallest and largest values. This helps you determine what stems you need.
Step 2: Create the stem column
List all the stems (tens digits) in order from smallest to largest in a vertical column.
Step 3: Add the leaves
Go through each data value and place the units digit (leaf) in the appropriate row next to its corresponding stem.
Step 4: Order the leaves
Rewrite the diagram with all leaves in numerical order from smallest to largest.
Step 5: Add a key
Always include a key showing how to read the stem and leaf notation.
Worked Example: Constructing a Stem and Leaf Diagram
Let's work through a complete example using test marks: 58, 65, 40, 59, 68, 63, 81, 76, 63, 57, 44, 47, 53, 70, 80, 68, 81, 61, 57, 49, 70, 54, 75, 69, 65, 59, 52, 63, 63, 74.
Step 1: The smallest value is 40 and the largest is 81, so we need stems from 4 to 8.
Step 2: Create the stem column:
4 |
5 |
6 |
7 |
8 |
Step 3: Add leaves by working through the data:
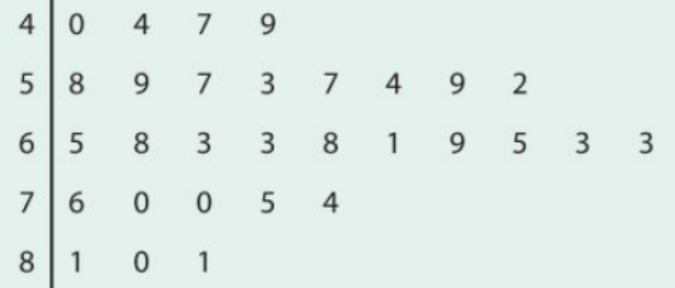
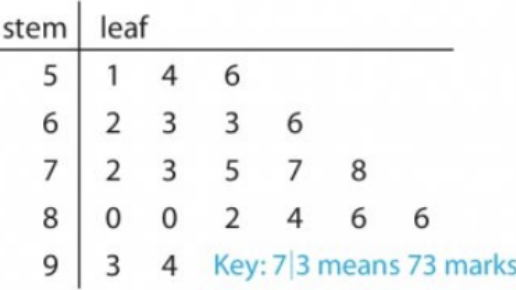
Step 4: Reorder the leaves from smallest to largest:
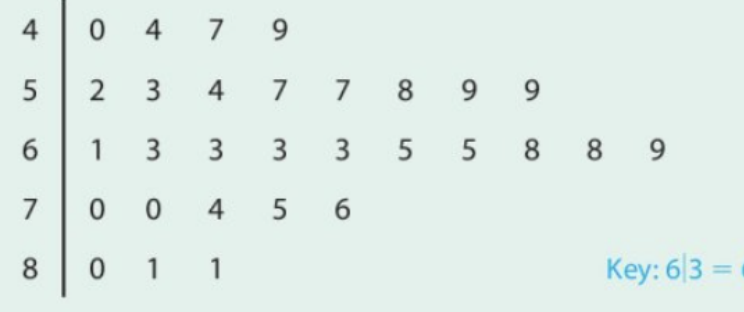
This gives us a clear visual representation of the data distribution, showing that most students scored in the 60s range.
Different values for stems
Sometimes your data might be decimal numbers. In this case, you can use the units digit as the stem and the decimal part as the leaf.
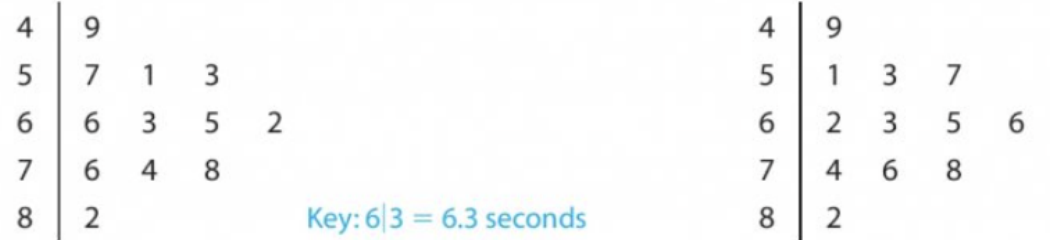
Decimal Data Example: With race times in seconds like 6.6, 4.9, 5.7, 7.6, 8.2, 6.3, 6.5, 7.4, 5.1, 5.3, 6.2, 7.8:
- The units become the stems (4, 5, 6, 7, 8)
- The tenths become the leaves
Back-to-back stem and leaf diagrams
When you need to compare two sets of data, you can create a back-to-back stem and leaf diagram. This uses the same stem column in the middle, with one set of leaves extending to the left and another set extending to the right.
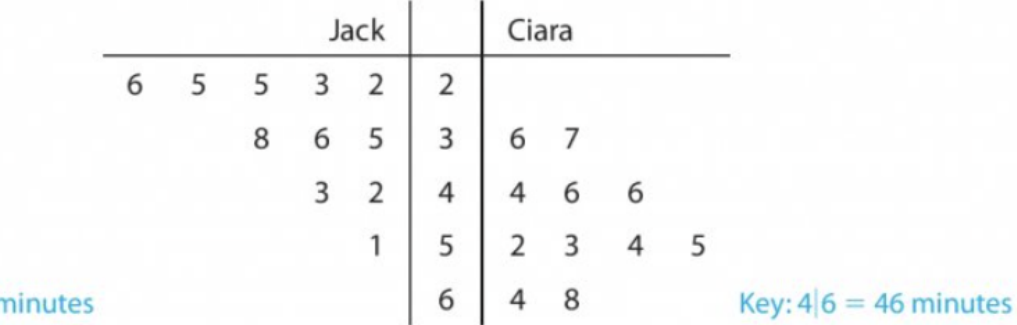
Comparison Benefits: This format makes it easy to compare the distributions of two datasets at a glance. You can quickly see which group has higher or lower values and how the data is spread.
Worked Example: Back-to-Back Comparison
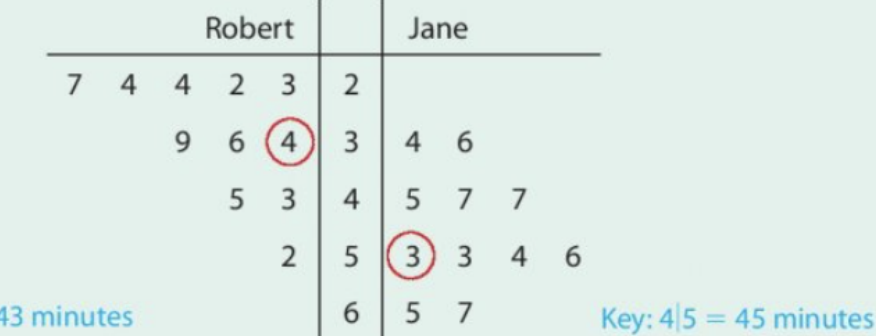
From this diagram comparing Robert and Jane's television watching times:
- Most of Robert's times are between 23 and 39 minutes
- Most of Jane's times are between 45 and 67 minutes
- Jane generally spends more time watching television than Robert
- The medians support this conclusion (Robert: 34 minutes, Jane: 53 minutes)
Finding quartiles from stem and leaf diagrams
You can use stem and leaf diagrams to find statistical measures like quartiles. Remember that quartiles divide your data into four equal parts.
Finding the median
The median is the middle value. If you have n values, the median position is
Finding quartiles
- Lower quartile (Q₁): The value at position
- Upper quartile (Q₃): The value at position
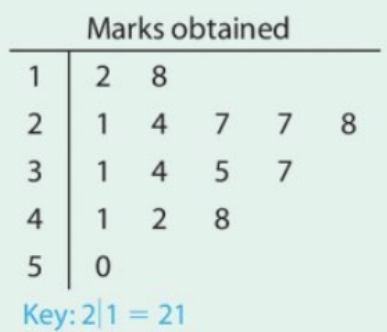
Worked Example: Finding Quartiles
For the marks data with 15 values:
- Median position:
- Lower quartile position:
- Upper quartile position:
- Interquartile range:
Common Mistakes to Avoid:
- Always include a key - this is essential and marks are often lost for missing keys
- Order your leaves - leaves must be in numerical order from smallest to largest
- Check your stems cover the full range - don't miss any stem values between your minimum and maximum
- Use consistent spacing - keep your diagram neat and aligned
- Double-check your data transfer - ensure all original values appear correctly in your diagram
Key Points to Remember:
- A stem and leaf diagram shows all original data values while displaying the overall distribution pattern
- The stem typically represents the tens digit and the leaf represents the units digit, but this can vary depending on your data
- You must always include a key to show how the stem and leaf notation works
- Back-to-back diagrams are perfect for comparing two datasets using the same stem values
- Stem and leaf diagrams make it easy to find statistical measures like median, mode, range, and quartiles by counting positions in the ordered data