Synoptic Weather Maps (Grade 10 NSC Matric Geography): Revision Notes
Synoptic Weather Maps: An Overview
What are synoptic weather maps?
A synoptic weather map provides a summary of weather conditions that have been recorded at a particular time. Think of it as a snapshot of the weather across a large area, showing what was happening at exactly the same moment everywhere on the map.
In South Africa, these maps show weather conditions recorded at 14:00 South African Standard Time (SAST). This timing is based on the 30°E longitude line, which serves as our time reference. These maps are incredibly useful because they allow meteorologists and geographers to see weather patterns across entire regions at once.
The standardized timing of 14:00 SAST ensures that all weather observations are taken simultaneously across the region, making it possible to create an accurate "snapshot" of atmospheric conditions. This synchronization is essential for understanding weather patterns and forecasting.
There are approximately 150 weather stations located around South Africa and nearby islands, including places like Gough Island, Tristan da Cunha, and Marion Island. Even ships at sea contribute weather readings to help create the most complete picture possible of atmospheric conditions.
Understanding weather station models
Weather information is displayed on synoptic maps using a weather station model. This is a standardised set of symbols arranged around a circle that shows all the important weather measurements taken at a specific location.
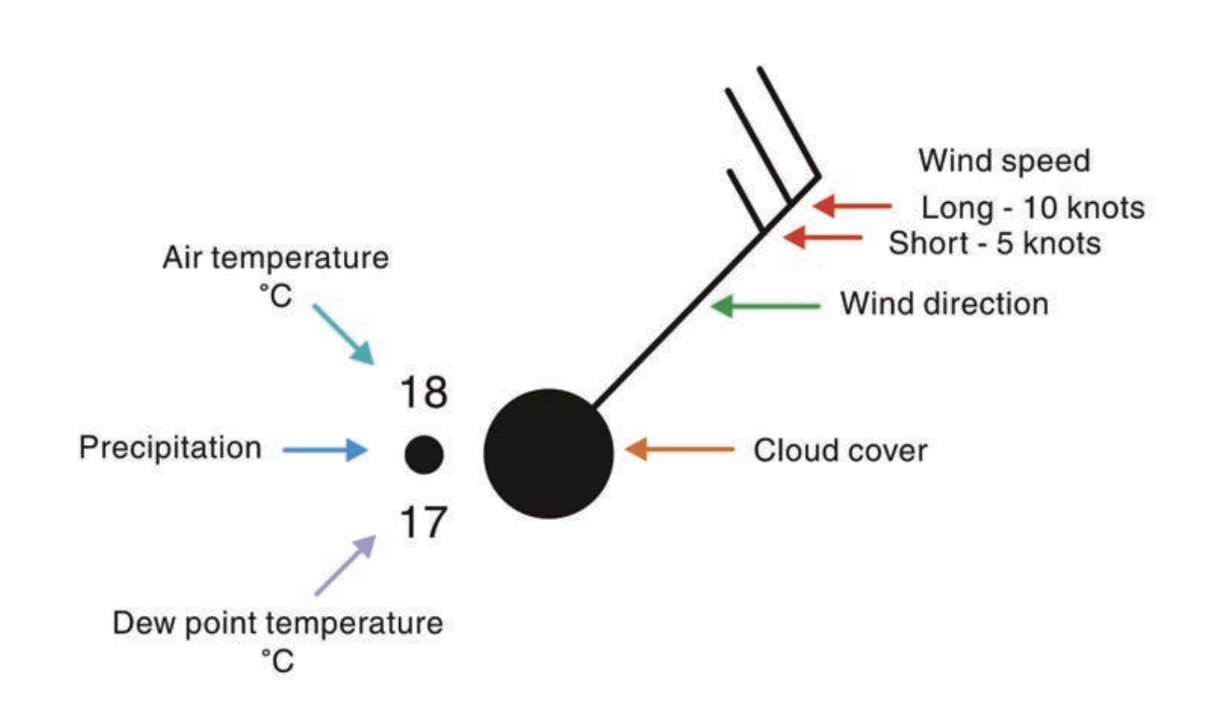
The weather station model uses a circle as its central point, with different weather elements positioned around it in specific locations. If weather readings have been sent to the South African Weather Service, the circle will be shaded according to the amount of cloud cover recorded at that station.
The circle at the center of each weather station model serves dual purposes: it acts as an anchor point for positioning other weather symbols, and its shading pattern immediately shows the cloud cover conditions at that location.
The six weather elements
Weather station models display six key weather elements that help us understand atmospheric conditions:
Air temperature
Air temperature appears as the top number on the left side of the weather station model. This shows the actual air temperature in degrees Celsius that was recorded at 14:00 SAST. For example, if you see "18" in this position, it means the air temperature was 18°C when the reading was taken.
Dew point temperature
The dew point temperature is shown as the lower number on the left side of the weather station model. This indicates the temperature at which water vapour in the air would condense into liquid water.
The dew point is particularly useful for understanding relative humidity levels:
- High relative humidity: When the difference between air temperature and dew point is 3°C or less
- Moderate relative humidity: When the temperature difference is between 4°C and 8°C
- Low relative humidity: When the temperature difference exceeds 8°C
Worked Example: Calculating Relative Humidity
If the air temperature is 22°C and the dew point is 19°C:
- Temperature difference = 22°C - 19°C = 3°C
- Since the difference is 3°C (≤ 3°C), this indicates high relative humidity
- The air is quite moist and close to saturation point
Wind direction
Wind direction is shown by a "tail" attached to the circle of the weather station model. This indicates the direction the wind is coming from, not where it's going to.
Common Mistake Alert: Remember that wind direction shows where the wind is blowing FROM, not where it's going TO. A northeasterly wind comes from the northeast and blows toward the southwest.
Here's a helpful tip: imagine the circle as an arrowhead, then look at where the tail points - this shows you the direction the wind is blowing from. For instance, if the tail points northeast, it means you have a northeasterly wind.
Wind speed
Wind speed is measured in knots and displayed using "feathers" at the end of the wind direction tail. The speed is shown in 5-knot intervals:
- A long feather represents 10 knots of wind speed
- A short feather represents 5 knots of wind speed
Remember that 1 knot equals 1.852 km/hr, making it the international standard for measuring wind speed.
Worked Example: Reading Wind Speed
If you see a wind direction tail with:
- 2 long feathers + 1 short feather
- Calculation: (2 × 10 knots) + (1 × 5 knots) = 25 knots
- Converting to km/hr: 25 × 1.852 = 46.3 km/hr
Cloud cover
Cloud cover is measured in eighths and shown by how much of the station circle is shaded:
- 1/8 coverage: Only a tiny sliver of the circle is shaded
- 1/4 coverage: A quarter of the circle is shaded
- 1/2 coverage: Half the circle is shaded
- 3/4 coverage: Three-quarters of the circle is shaded
- Overcast: The entire circle is completely shaded, meaning no blue sky is visible
Precipitation
The type of precipitation occurring at the time of the weather reading is shown by symbols drawn between the air temperature and dew point temperature values. These symbols indicate what form of precipitation (if any) was falling when the observations were recorded.
Weather conditions and symbols
Synoptic weather maps use a standardised set of symbols to represent different weather conditions. These symbols help meteorologists and weather enthusiasts quickly identify what type of weather was occurring at each station.
Common weather symbols include:
- Rain: Represented by dots
- Snow: Shown with asterisk-like symbols
- Drizzle: Displayed with smaller precipitation symbols
- Thunderstorms: Indicated by lightning bolt symbols
- Fog: Shown with horizontal line symbols
- Showers: Represented by inverted triangles
Weather symbols are internationally standardized, meaning a meteorologist in South Africa can read a weather map from any country in the world using the same symbol system. This universal language of weather makes global weather monitoring and forecasting possible.
The symbols are divided into two categories:
- Present weather (ww): What was happening at the exact time of observation
- Weather during the preceding hour: What occurred in the hour before the observation but not at the time of recording
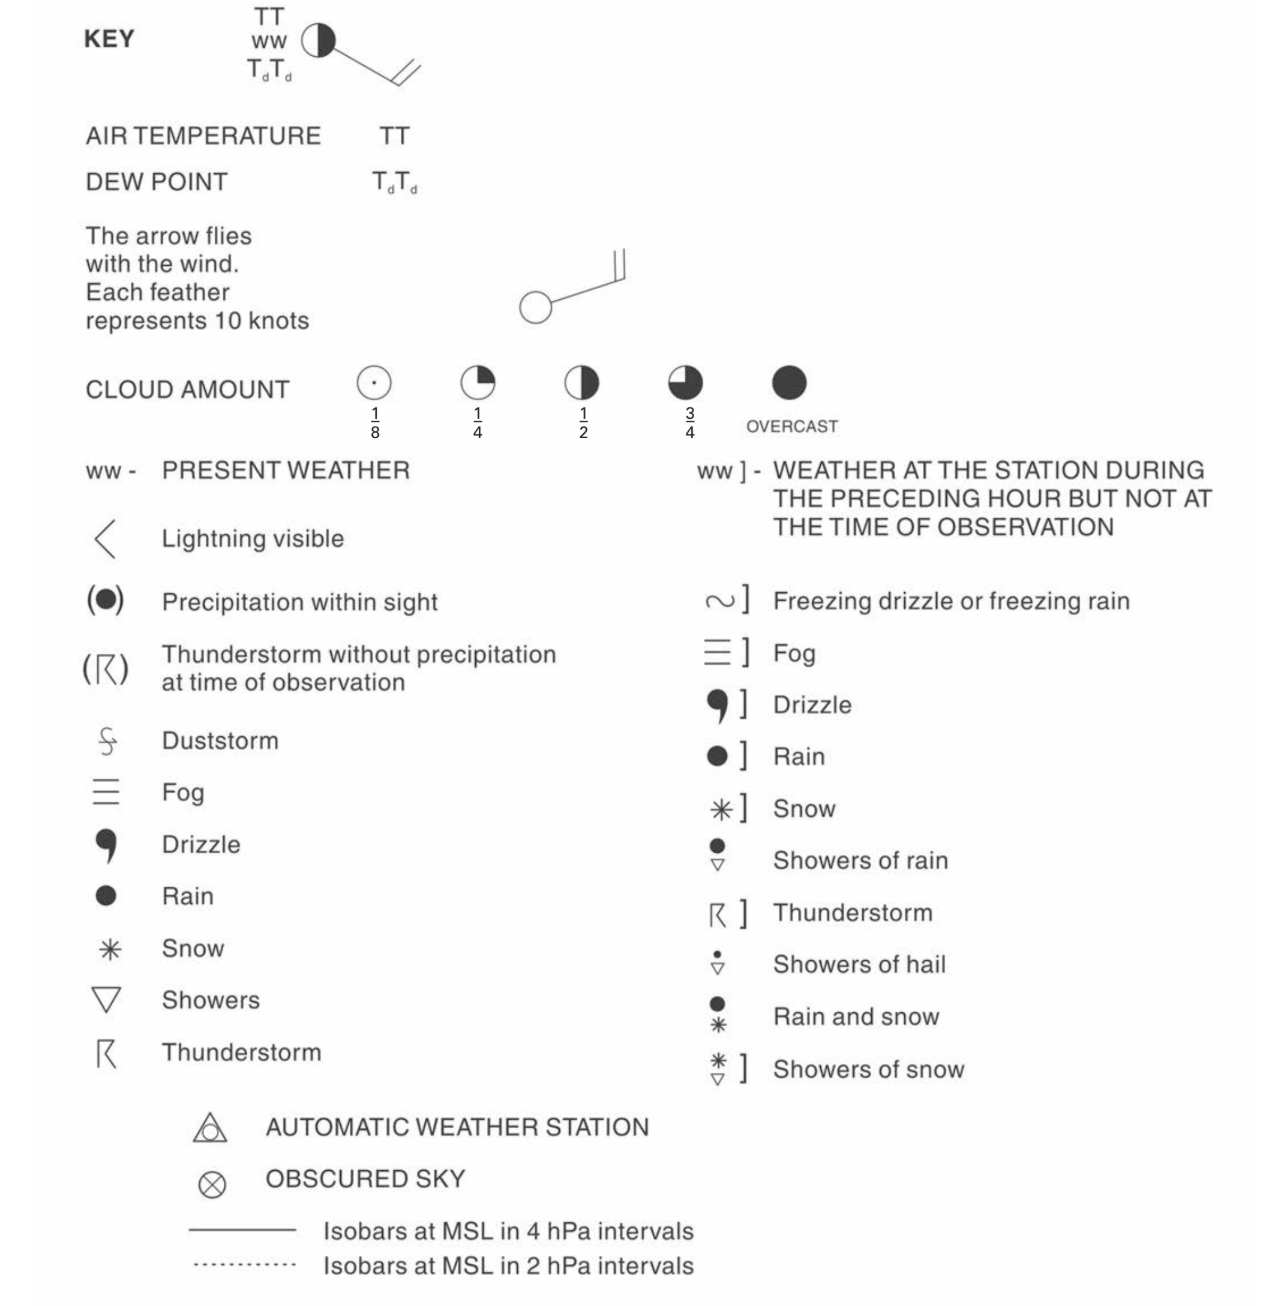
Atmospheric pressure and isobars
While atmospheric pressure isn't shown directly on individual weather station models, it's displayed on synoptic weather maps through isobars. An isobar is a line connecting all places that have the same sea level air pressure.
Atmospheric pressure is measured in hectopascals (hPa), where 1 hPa equals 1 millibar (mb). On synoptic maps, you'll see:
- Solid lines: Represent isobars at 4 hPa intervals
- Dotted lines: Represent isobars at 2 hPa intervals
Key Concept: All pressure readings are standardized to mean sea level (MSL) to allow for fair comparison between locations at different altitudes. Without this standardization, a weather station on a mountain would always show lower pressure simply due to elevation, not weather conditions.
These pressure readings are standardised to mean sea level (MSL) to allow for fair comparison between locations at different altitudes.
Special station types
Weather maps also include symbols for different types of weather monitoring stations:
- Automatic weather stations: Represented by triangle symbols
- Obscured sky conditions: Shown by circles with an X through them
These different station types help meteorologists understand the source and reliability of the weather data being displayed.
Key Points to Remember:
- Synoptic weather maps show weather conditions recorded simultaneously across a region at 14:00 SAST
- Weather station models use standardised symbols arranged around a circle to display six key weather elements
- The six weather elements are: air temperature, dew point temperature, wind direction, wind speed, cloud cover, and precipitation
- Wind direction shows where wind is coming FROM, not where it's going TO
- Cloud cover is measured in eighths, with a fully shaded circle indicating overcast conditions
- Isobars connect places with equal atmospheric pressure and help identify pressure systems and weather patterns
- Relative humidity can be estimated by comparing air temperature and dew point temperature differences