Reading and Interpreting Synoptic Weather Maps (Grade 10 NSC Matric Geography): Revision Notes
Reading and Interpreting Synoptic Weather Maps
What are synoptic weather maps?
A synoptic weather map is a specialised meteorological chart that displays weather conditions across a large geographical area at a specific point in time. These maps are essential tools for understanding current weather patterns and making weather predictions. In South Africa, synoptic weather maps are produced regularly to show weather conditions across the southern African region.
The word "synoptic" means "giving a general view of the whole" - which perfectly describes what these maps do. They provide meteorologists and geography students with a comprehensive overview of atmospheric conditions across vast areas, allowing us to see the "big picture" of weather systems.
Key features of synoptic weather maps
Synoptic weather maps contain several important elements that work together to tell the complete weather story. Understanding each of these features is crucial for accurate map interpretation.
Isobars and pressure systems
Isobars are curved lines drawn on weather maps that connect all locations experiencing the same atmospheric pressure. Think of them like contour lines on a topographic map, but instead of showing elevation, they show areas of equal air pressure measured in hectopascals (hPa).
The isobaric interval refers to the pressure difference between consecutive isobars on a map. In South African weather maps, this interval is typically 4 hPa. This means each isobar line represents a pressure reading that differs by 4 hPa from the adjacent lines.
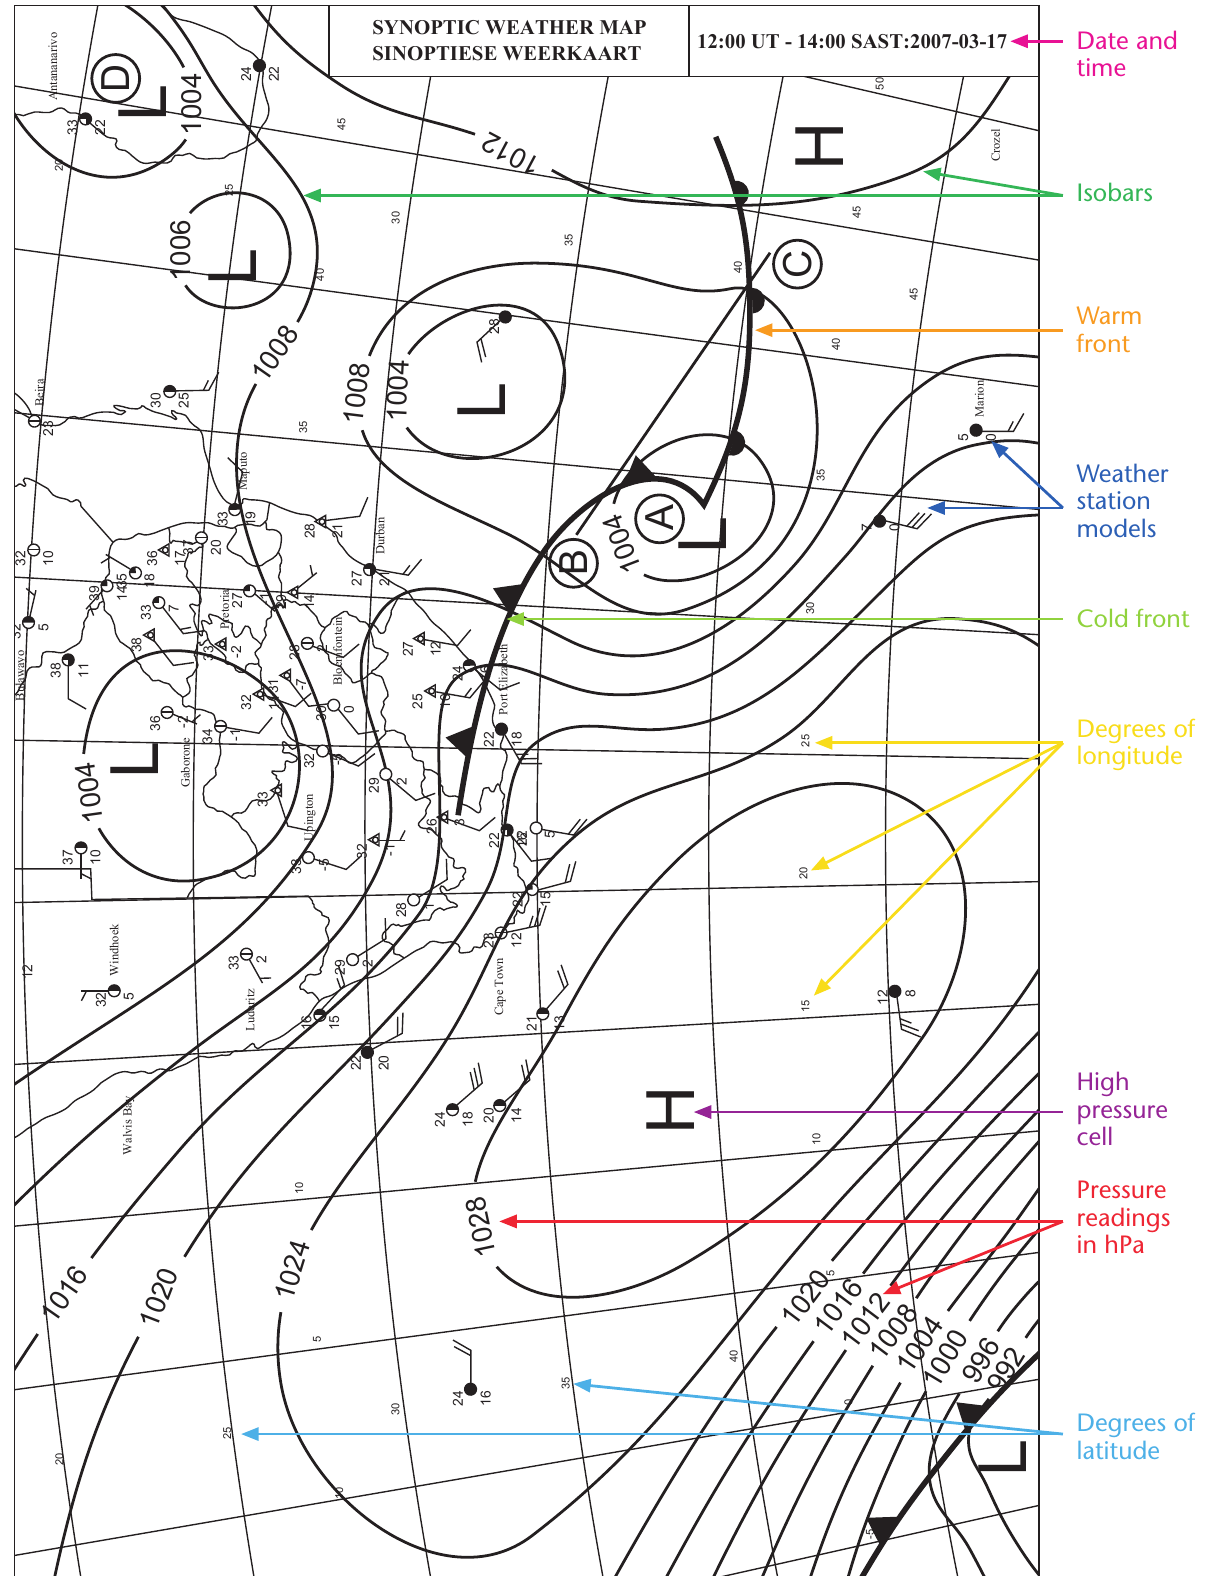
When reading pressure values on synoptic maps, remember that high hPa readings indicate high atmospheric pressure, whilst low hPa readings show areas of low pressure. You can identify these patterns by examining how the numbers change from one isobar to the next.
Pressure cells and systems
Weather maps clearly show high pressure cells and low pressure cells, which are fundamental to understanding weather patterns.
High pressure cells are marked with a large "H" symbol and appear as roughly circular or oval-shaped patterns where isobars form closed loops. In these areas, the innermost isobar shows the highest pressure reading. High pressure systems typically bring stable, dry and fine weather conditions.
Low pressure cells are marked with a large "L" symbol and also appear as closed isobar patterns, but here the innermost isobar shows the lowest pressure reading. These systems are usually associated with rising air, cloud formation and unstable weather, and may bring rain and stronger winds.
When isobars form closed "circles" around these pressure centres, they create what meteorologists call pressure cells. The spacing between isobars also provides important information - closely spaced isobars indicate strong pressure gradients and typically stronger winds.
Weather fronts
Synoptic weather maps show weather fronts using specific line symbols with attached triangles. These fronts represent boundaries between different air masses with contrasting temperatures and characteristics.
Cold fronts are shown as lines with triangular symbols pointing in the direction of movement. On South African synoptic maps, these are the fronts most commonly identified and tested. These fronts are commonly associated with mid-latitude cyclones located south-west or south of South Africa.
Weather station models
Small symbols scattered across the map represent weather station models. These provide detailed local weather information for specific locations, including temperature, wind direction and speed, cloud cover, and precipitation. Learning to read these station models allows you to understand local conditions within the broader weather pattern.
Coordinate systems and timing
Every synoptic weather map includes important reference information:
- Date and time: Maps specify both Universal Time (UT), based on the Greenwich Meridian, and South African Standard Time (SAST), based on 30°E longitude
- Latitude lines: Marked every 5 degrees to show north-south position
- Longitude lines: Also marked every 5 degrees to show east-west position
This coordinate system allows precise location referencing and helps users understand the geographical scope of weather systems.
Reading pressure patterns
Understanding how to interpret pressure patterns is crucial for weather map analysis. Start by locating the pressure readings on various isobars - these numbers tell you whether you're looking at a high or low pressure area.
To identify the isobaric interval, find two adjacent isobars and calculate the pressure difference between them.
Worked Example: Calculating Isobaric Interval
Step 1: Locate two adjacent isobars on the map
Step 2: Read the pressure values
- First isobar: 1008 hPa
- Second isobar: 1012 hPa
Step 3: Calculate the difference Isobaric interval = 1012 - 1008 = 4 hPa
High pressure cells create distinctive patterns where pressure increases toward the centre, whilst low pressure cells show the opposite pattern with pressure decreasing toward the centre. The shape and intensity of these pressure systems influence local weather conditions significantly.
Interpreting weather patterns
When analysing a synoptic weather map, look for the relationship between different weather features. Mid-latitude cyclones (low pressure systems) often have weather fronts associated with them, bringing changeable conditions. High pressure systems typically dominate with more stable weather patterns.
The positioning of these systems relative to South Africa determines what weather conditions different regions will experience. Understanding these patterns helps explain why coastal areas might experience different weather from inland regions on the same day.
Using weather comparison tables
Weather maps can be analysed using comparison tables that examine conditions between different locations. These tables typically include:
| Weather conditions | Location 1 | Location 2 |
|---|---|---|
| Temperature | ||
| Precipitation | ||
| Wind direction | ||
| Wind speed | ||
| Cloud cover | ||
| Dew point temperature |
Such comparisons help identify how different weather systems affect various parts of the country simultaneously.
Exam tips for map interpretation
When answering questions about synoptic weather maps, always follow these essential steps:
Critical Steps for Map Analysis:
- Start by identifying the date and time of the map
- Locate high and low pressure systems using the H and L symbols
- Read pressure values carefully, noting the isobaric interval
- Look for weather fronts and their relationship to pressure systems
- Use the coordinate grid to specify exact locations
- Consider how pressure patterns might affect local weather conditions
Key Points to Remember:
- Isobars connect points of equal atmospheric pressure - they're like contour lines for air pressure
- High pressure systems (H) generally bring stable, dry and fine weather, whilst low pressure systems (L) are associated with unstable conditions and may bring rain
- The isobaric interval in South African maps is typically 4 hPa between consecutive lines
- Cold fronts are commonly found near mid-latitude cyclones south-west or south of South Africa
- Always check the date and time reference when interpreting any synoptic weather map, as conditions change rapidly