Classifying and Organising Data (Grade 10 NSC Matric Mathematical Literacy): Revision Notes
Classifying and Organising Data
Understanding how to classify and organise data forms the foundation of effective data handling. Once you have collected your data, the next crucial step involves sorting it into meaningful categories and presenting it in ways that make analysis easier.
Understanding data types
Data can be classified into two main categories, each with distinct characteristics that determine how we work with the information. Recognizing these fundamental differences is essential for choosing the appropriate analysis methods.
Understanding data types is the first step in any data analysis process. The type of data you're working with determines which statistical methods and visualization techniques you can use.
Categorical data
Categorical data refers to information that cannot be measured numerically but can be described using words or labels. This type of data involves characteristics or qualities rather than quantities.

Examples of categorical data include:
- Gender (male or female)
- Colours of sweets in a jar
- Types of transport (car, bus, bicycle)
- Hair colour (brown, black, blonde)
Key characteristic: Categorical data describes what something is rather than how much or how many. You cannot perform mathematical calculations like addition or subtraction on categorical data.
Numerical data
Numerical data involves information that can be measured using numbers. This data type allows for mathematical calculations and comparisons between values.
Examples of numerical data include:
- Height of a person
- Number of books in your bag
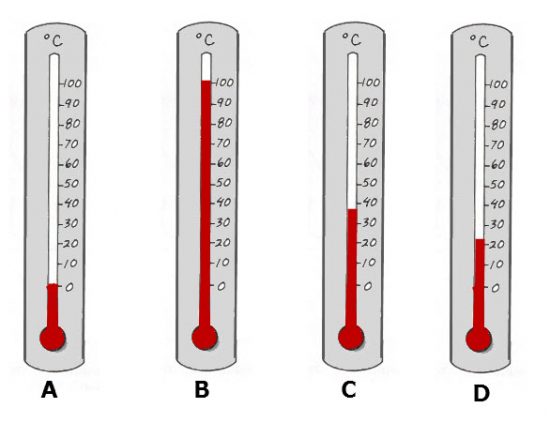
- Temperature readings
- Age in years
Numerical data is further divided into two important subcategories that affect how we collect, organize, and analyze the information.
Discrete data
Discrete data represents values that can only take specific, countable numbers. Each measurement has one exact value that cannot be divided into smaller meaningful parts.
Remember: Data is discrete if each value can only have one specific value that can be counted. You cannot have fractional parts of discrete measurements.
Examples of discrete data:
- Number of bicycles (1, 5, 8 - not 4½ bicycles)
- Number of puppies in a litter (3 puppies, 6 puppies - not ¾ of a puppy)
- Number of students in a class
Continuous data
Continuous data can take any value within a given range, including decimal values. These measurements are not limited to specific whole numbers.
Examples of continuous data:
- A person's weight (could be 67,4 kg or 78,3 kg)
- Amount of rainfall (can be any measurement, not limited to specific quantities)
- Temperature (can be measured to decimal places)
Key insight: Continuous data can theoretically be measured to infinite precision, limited only by the accuracy of your measuring instrument.
Methods for organising data
Once data has been classified, it needs to be organised in ways that make it easy to understand and analyse. The method you choose depends on the type of data you're working with and the size of your dataset. There are three main methods for organising data effectively.
Tallies
Tallies provide a method for counting how many items fall into each category. The main advantage of using tallies lies in maintaining a running total as you collect data.
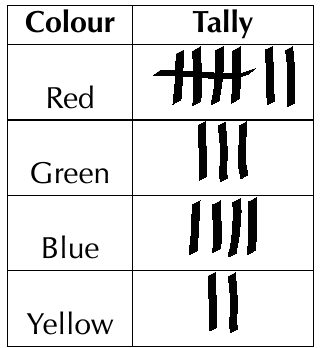
When creating tally marks:
- Each item gets one mark
- After four marks, draw a line through them to represent five
- This grouping system makes counting easier and reduces errors
Advantage of tallies: They allow you to collect and count data simultaneously, which is particularly useful when gathering information in real-time situations like surveys or observations.
Frequency tables
Frequency tables display categories alongside the number of times each item appears in the data set. These tables convert tally information into a cleaner, more professional format.
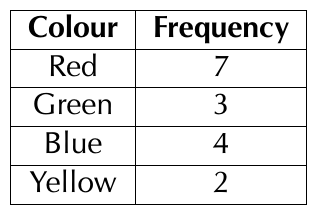
The frequency table shows the same information as the tally chart but presents it more clearly for analysis and reporting purposes. Frequency tables are particularly essential for identifying patterns and making comparisons between different categories.
Class intervals
Class intervals become necessary when dealing with large amounts of continuous data. Instead of listing every individual value, data gets grouped into ranges or bands.
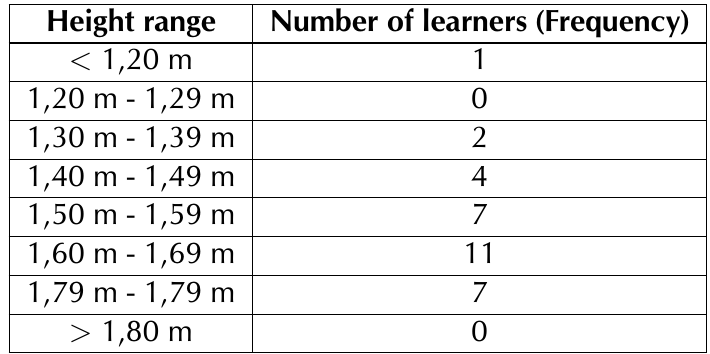
Critical rule for class intervals:
- Include the lower boundary but not the upper boundary in each interval
- For example, 1,60 m - 1,69 m includes 1,60 m but excludes 1,69 m
- A measurement of 1,69 m would belong in the next interval (1,69 m - 1,79 m)
Class intervals are particularly useful when you have large datasets where listing every individual value would create unwieldy tables that are difficult to read and analyze.
Worked example: Working with grouped data
Worked Example: Analyzing Plant Height Data
Question: This frequency table shows the heights of seedlings measured in millimetres.

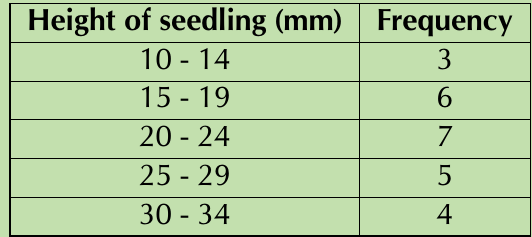
- How many plants were measured altogether?
- How many plants are less than 20 mm high?
- How many plants are more than 25 mm high?
- Into which interval would you place a plant that is 29,8 mm high?
- How many plants are at least 25 mm high?
Solution:
-
Total plants measured: 3 + 6 + 7 + 5 + 4 = 25 plants altogether
-
Plants less than 20 mm: Plants in intervals below 20 mm: 3 + 6 = 9 plants (from 10-14 mm and 15-19 mm intervals)
-
Plants more than 25 mm: Plants in intervals above 25 mm: 5 + 4 = 9 plants (from 25-29 mm and 30-34 mm intervals)
-
Placement of 29,8 mm plant: Since we include the lower boundary but not the upper boundary, 29,8 mm belongs in the 25-29 mm interval (29,8 is less than 30)
-
Plants at least 25 mm: "At least 25 mm" means 25 mm or higher, so we count all plants in intervals from 25 mm upwards: 5 + 4 = 9 plants
Exam tips
Critical exam strategies:
- Always check whether boundaries are included or excluded in class intervals
- When asked for "less than" a value, exclude that exact value
- When asked for "at least" a value, include that exact value
- Double-check your addition when finding totals from frequency tables
- Remember that discrete data uses exact counting numbers while continuous data can have decimal values
- Read the question carefully to understand whether you need "less than", "more than", "at least", or exact values
Key Points to Remember:
- Categorical data describes qualities using words, while numerical data uses numbers for measurement
- Discrete data involves exact countable values, continuous data can be any value within a range
- Tallies help maintain running counts, frequency tables present data clearly, and class intervals group large amounts of data
- Class intervals include the lower boundary but exclude the upper boundary
- Always read questions carefully to understand whether you need "less than", "more than", "at least", or exact values
- The method you choose for organizing data depends on both the type of data and the size of your dataset