Fieldwork (Grade 11 NSC Matric Geography): Revision Notes
Collecting, Processing, and Presenting Findings
Understanding data collection
When conducting fieldwork, geographers work with two main types of data that serve different purposes in their research. Understanding these types helps you plan your investigation effectively and ensures you gather the right information to answer your research questions.
Primary data refers to information you collect yourself directly from the field through your own observations and measurements. This is the most valuable type of data for your research because it addresses your specific research question. Examples include measurements you take in the field, photographs you capture, field sketches you draw, photo-sketches you create, maps you produce, and interviews you conduct yourself. The amount of primary data you collect will depend on your research topic and the scope of your investigation.
Secondary data comes from sources other than your own fieldwork. This includes information gathered by other researchers, experts, or organisations. Common sources include expert knowledge, internet resources, newspapers, books, magazines, and academic journals. While secondary data supports your research, you must always acknowledge where this information comes from and reference it properly.
Key Definitions:
Primary data - the actual data collected in the field by a researcher through their own direct observations and measurements.
Secondary data - all the data collected from sources other than the primary data collected in the field by a researcher, including expert knowledge, books, internet resources, and academic journals.
Recording data properly
Accurate data recording forms the foundation of successful fieldwork. You cannot rely entirely on secondary sources, which makes collecting your own primary data in the field absolutely essential for quality geographical research.
Avoiding plagiarism is crucial when working with any data sources. Plagiarism means copying someone else's words, thoughts, ideas, or expressions and presenting them as your own original work. This is completely unacceptable in academic work. Always put information you read into your own words, cite your sources correctly, and keep detailed records of where your information comes from. When you use images from the internet, such as maps from Google Earth, these must also be properly referenced.
Plagiarism Warning:
Plagiarism is defined as "the close imitation, or publication, of another author's language, thoughts, ideas, or expressions, and the representation of them as one's own original work."
To avoid plagiarism:
- Always put information into your own words
- Cite all sources correctly
- Keep detailed records of where information comes from
- Reference all images, maps, and data from external sources
Proper sourcing involves keeping track of all your references in one place so you can include them in your final report. This applies to any material you didn't create yourself, whether it comes from books, websites, interviews, or other sources.
The enquiry approach
Successful fieldwork follows a systematic six-step enquiry approach that helps you collect and analyse data effectively to solve geographical problems:
The Six-Step Enquiry Process:
- Step 1: Identify the research topic - Choose a clear, focused research question that you can investigate through fieldwork
- Step 2: Ask questions - Develop specific questions that will help you gather relevant information
- Step 3: Collect data - Gather information from both primary and secondary sources
- Step 4: Interpret data and information - Analyse what your data tells you about your research question
- Step 5: Write up data and offer solutions - Present your findings clearly and suggest answers to your research question
- Step 6: Compile a report - Organise all your work into a professional, structured document
Processing your fieldwork findings
Good geographers don't just collect data - they explain and analyse their results effectively. When processing your fieldwork findings, keep your interpretation focused and include only information that directly relates to your enquiry. Avoid using too many graphs or diagrams that don't add value to your analysis.
Critical analysis questions help you understand what your data means. Ask yourself:
- What patterns or trends does my data show?
- Are there any unusual features or unexpected results?
- Why might these patterns exist?
- What could explain the results I'm seeing?
- How does this data help answer my original research question or test my hypothesis?
Example: Critical Data Analysis
When analysing river flow data collected during fieldwork:
Step 1: Identify patterns - "Flow rate decreases from 2.3 m/s upstream to 1.1 m/s downstream"
Step 2: Explain the pattern - "This decrease occurs because the river widens and becomes shallower downstream"
Step 3: Link to research question - "This supports my hypothesis that urban development has altered natural flow patterns"
Presenting your data
Your fieldwork data can be presented using several different visual methods, each suited to different types of information. Choosing the right presentation method helps your audience understand your findings quickly and clearly.
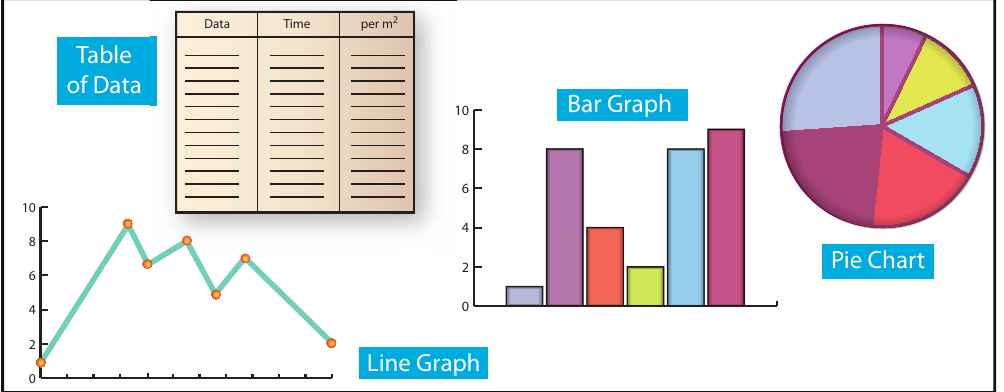
Tables of data work well for showing exact numerical values and making precise comparisons between different measurements or locations.
Line graphs effectively display changes over time or relationships between two continuous variables. They're particularly useful for showing trends and patterns.
Bar graphs compare different categories or groups clearly, making it easy to see which values are largest or smallest.
Pie charts show how a total amount is divided into different parts, helping readers understand proportions and percentages.
Example: Choosing Data Presentation Methods
For temperature data over 24 hours: Use a line graph to show the continuous change in temperature throughout the day.
For comparing pollution levels at 5 different sites: Use a bar graph to clearly compare the different locations.
For showing how total rainfall is distributed across seasons: Use a pie chart to display the proportional breakdown.
For recording exact measurements at each sampling point: Use a table to present precise numerical data.
Writing your fieldwork report
Research reports become much easier to compile when you stay organised throughout your fieldwork process and follow a clear structure. A well-written report has three main sections that flow logically from introduction through analysis to conclusions.
Introduction section
Start your report with a title page that includes your name and any group members involved. Create a table of contents with correct page numbers for all sections. Begin with your research topic heading, then clearly state your research question or hypothesis. Keep this section concise - no more than two to three pages.
Introduction Section Checklist:
- Title page with names
- Table of contents with page numbers
- Clear research question or hypothesis
- Brief explanation of research aims
- Why the topic matters (2-3 pages maximum)
Briefly explain what your research investigates, your aims and objectives, and why this topic matters. Your table of contents must include page numbers and list all the different sections of your research report.
Main part section
This forms the longest section of your report, but avoid writing too much unnecessary detail. Describe your data collection methods clearly, explaining how you gathered your information. Present your data in a logical order with appropriate headings and captions.
Include your tables, graphs, photographs, field sketches, and maps within the main text rather than separating them into appendices. Your raw primary data, such as completed questionnaires, interviews, and original articles, can be added as an appendix. Remember to reference all secondary data sources and acknowledge any assistance you received during your research.
Conclusion section
This is where you answer your research question or determine whether your hypothesis was correct or incorrect. Support your conclusions by referring back to specific figures or pages in the main part of your report. Your conclusion represents the most important section of your entire report but should not exceed two pages in length.
Quality criteria for successful reports
Professional fieldwork reports meet specific standards that demonstrate thorough preparation and careful attention to detail. Use this checklist to ensure your report meets academic requirements:
Essential Report Requirements:
- A proper title page with your name and group members' names
- Staying within any word-count limits you were given
- Numbering all pages correctly
- Including a table of contents with accurate page numbers
- Clearly labelling all tables, graphs, photographs, maps, and field sketches with headings or captions
- Discussing and analysing all data you present
- Using correct headings in the proper sequence
- Referencing secondary data sources correctly
- Including raw data in an appendix
- Submitting your project by the deadline
Key Points to Remember:
- Primary data comes from your own fieldwork observations, while secondary data comes from other sources - both are important for complete research
- Always avoid plagiarismby putting information into your own words and referencing all sources properly
- Follow the six-step enquiry approach to structure your fieldwork: identify, ask, collect, interpret, write, compile
- Choose appropriate presentation methods - tables for exact values, line graphs for trends, bar graphs for comparisons, pie charts for proportions
- Structure your report clearly with introduction, main part, and conclusion sections that flow logically and answer your research question