Application of GIS (Grade 11 NSC Matric Geography): Revision Notes
Application of GIS
Geographic Information Systems (GIS) are powerful tools that help us analyse and understand spatial data in the real world. This technology has countless practical applications that benefit society, from monitoring natural disasters to protecting critical infrastructure. Let's explore how GIS is used in South Africa and around the world.
Real-world case study: Advanced Fire Information System (AFIS)
One of the most impressive examples of GIS application in South Africa is the Advanced Fire Information System (AFIS). This system demonstrates how modern technology can solve real-world problems and protect both the environment and essential services.
The problem that needed solving
The Challenge: Veld fires were regularly causing power outages across South Africa, costing Eskom significant money and causing widespread inconvenience to customers.
In the mid-2000s, Eskom (South Africa's electricity utility company) faced a costly challenge. Veld fires were regularly causing power outages across the country. When a large fire occurs near power transmission and distribution lines, it heats the air and creates conditions for electrical short circuits. These short circuits can damage power lines and leave entire communities without electricity.
Eskom realised they could save significant amounts of money and prevent frustration for customers if they could receive early warnings about fires near their power infrastructure. This would allow them to take preventive action, such as temporarily shutting down power lines in affected areas.
How the AFIS system works
The solution came through collaboration between Eskom, the Satellite Application Centre at Hartebeesthock (now part of SANSA - the South African Space Agency), and various scientists. Here's how this remarkable system operates:
System Workflow: From Satellite to Alert
Step 1: Satellite Detection
- MeteoSat Second Generation (MSG) satellites and MODIS sensors detect thermal signatures
Step 2: Data Processing
- Computer programs identify hot spots from temperature anomalies
Step 3: GIS Conversion
- Hot spots converted to point vector data in spatial database
Step 4: Spatial Analysis
- System automatically checks distance between fires and power lines
Step 5: Automated Response
- Alerts sent via email and SMS when fires detected near infrastructure
Satellite monitoring: Two types of satellite sensors continuously monitor southern Africa:
- MeteoSat Second Generation (MSG) satellites in geostationary orbit
- MODIS sensors on Terra and Aqua satellites that orbit Earth
These satellites use special sensors that can detect thermal bands (heat signatures) from space. When a fire burns, it creates a distinctive heat pattern that these satellites can identify.
Data processing: The satellite images are processed using sophisticated computer programs that identify pixels showing unusually high temperatures - these are called hot spots. Scientists have established that these hot spots reliably indicate the presence of active fires.
The thermal detection technology is so sensitive that it can identify fires as small as a few square meters from hundreds of kilometers above Earth's surface.
Converting to GIS data: The identified hot spots are converted into point vector data and stored in a spatial database. This allows the fire information to be analysed geographically and combined with other spatial data.
Automated analysis: The GIS system has been programmed to automatically check whether detected fires are close to Eskom power lines. This is a perfect example of spatial analysis in action - the system can determine the relationship between two different types of geographic features.
Alert system: When a fire is detected near power infrastructure, the system automatically sends alerts to relevant personnel via email and SMS. This allows rapid response to prevent power outages.
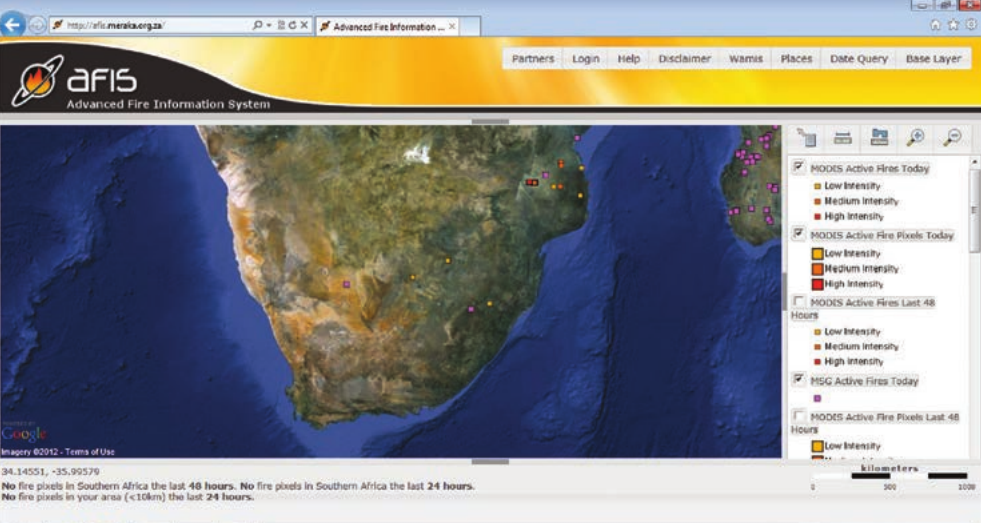
The AFIS web interface shows real-time fire monitoring across southern Africa, with different coloured markers indicating fire intensity levels and timing.
Additional features and improvements
AFIS continues to evolve and improve its capabilities:
- Weather integration: The system incorporates meteorological wind data from the South African Weather Service (SAWS). Wind speed and direction symbols help predict where fires might spread.
- Fire prediction models: Advanced GIS models use wind data to predict the likely path and speed of fire movement, enabling even better preparation and response.
- Web-based accessibility: The system provides layers in a web map format, making fire information accessible to various users including fire protection associations (FPAs) and other organisations.
- Multiple time frames: The system can display fire activity over different periods (24 hours, 48 hours) to show fire development and trends.
Other important applications of GIS
The AFIS system is just one example of how GIS technology serves society. Many other fields use similar approaches to solve complex spatial problems:
Oceanography
Organisations like the Centre for Observational Oceanography use GIS to monitor ocean conditions, track currents, and study marine ecosystems. This information is crucial for understanding climate change, managing fisheries, and ensuring maritime safety.
Meteorology
Weather services worldwide rely on GIS to analyse atmospheric data, predict weather patterns, and issue warnings for severe weather events. This helps protect lives and property from storms, floods, and other weather-related hazards.
Climatology
Climate research institutes use GIS to study long-term environmental changes. For example:
- Climate systems analysis groups examine temperature and precipitation patterns over time
- Risk and vulnerability atlases help communities prepare for climate-related challenges
- Researchers can identify areas most susceptible to drought, flooding, or other climate impacts
GIS in Environmental Monitoring
These applications all share common principles with AFIS: they combine multiple data sources, use spatial analysis to identify patterns and relationships, and provide actionable information to decision-makers.
Understanding data capture and georeferencing
For GIS applications to work effectively, all spatial data must be properly prepared and referenced. This process is fundamental to how GIS systems operate.
What is georeferencing?
Definition: Georeferencing
Georeferencing is the process of assigning accurate spatial coordinates to data so it can be correctly positioned and overlaid with other spatial information in a GIS. Think of it as giving every piece of data a precise address on Earth's surface.
This process is essential because GIS systems need to know exactly where different features are located to analyse their relationships accurately. For example, the AFIS system must know the precise coordinates of both fires and power lines to determine if they're dangerously close to each other.
The importance of map projections
Definition: Map Projection
A map projection is any method of representing Earth's curved surface (which is essentially spherical) on a flat plane, such as a computer screen or paper map. Since Earth is round and maps are flat, some distortion is inevitable when creating any map projection.
For GIS systems to work properly, all data layers must use the same map projection. If different datasets use different projections, they won't align correctly when overlaid, leading to inaccurate analysis and potentially dangerous decisions.
How data layers work together
GIS operates on the principle that different types of spatial information can be stored as separate layers and then combined for analysis. Just like tracing different themes on separate sheets of transparent paper and then stacking them together, GIS allows users to overlay various data types to reveal patterns and relationships.
Data Layer Integration in AFIS
The AFIS system demonstrates perfect layer integration by combining:
- Satellite imagery showing the landscape
- Fire detection points from thermal sensors
- Power line locations from Eskom's infrastructure database
- Weather data showing wind patterns
- Administrative boundaries showing different regions
When properly georeferenced with the same map projection, these layers align perfectly for accurate spatial analysis.
When these layers are properly georeferenced and use the same map projection, they align perfectly, allowing the system to perform accurate spatial analysis.
Key Points to Remember:
-
GIS has practical real-world applications - The AFIS system demonstrates how GIS technology solves genuine problems by preventing power outages and protecting infrastructure from fire damage
-
Multiple data sources create powerful analysis - Combining satellite imagery, infrastructure data, and weather information allows for sophisticated monitoring and prediction capabilities
-
Georeferencing is essential - All spatial data must be properly positioned using the same map projection for GIS analysis to work accurately
-
GIS applications span many fields - From fire monitoring to oceanography, meteorology, and climate research, GIS technology serves diverse scientific and practical needs
-
Automation enables rapid response - Modern GIS systems can automatically analyse spatial relationships and send alerts, allowing for quick responses to emerging situations