Spatial and Spectral Resolution (Grade 11 NSC Matric Geography): Revision Notes
Spatial and Spectral Resolution
This guide covers two fundamental concepts in Geographic Information Systems (GIS): spatial resolution (how detailed our geographic data is) and spectral resolution (how many different wavelengths of light sensors can detect). Understanding these concepts is essential for working with satellite imagery and digital maps.
Understanding spatial resolution
Spatial resolution describes the level of detail we can see in geographical data. Think of it as how "zoomed in" our view is - higher resolution means we can see smaller details, while lower resolution gives us a broader, less detailed picture.
The scale we work with depends on our purpose. We might use terms like "local", "regional", "national" or "global" to describe different spatial scales.
Spatial resolution in raster data
In raster data, spatial resolution is determined by the pixel size. A pixel is the smallest building block of digital images - like tiny coloured squares that make up a picture on your computer screen.
Understanding Pixels
When we zoom into a raster image, we eventually see individual squares or pixels. Think of pixels like tiles in a mosaic - the smaller the tiles, the more detailed the final picture can be.
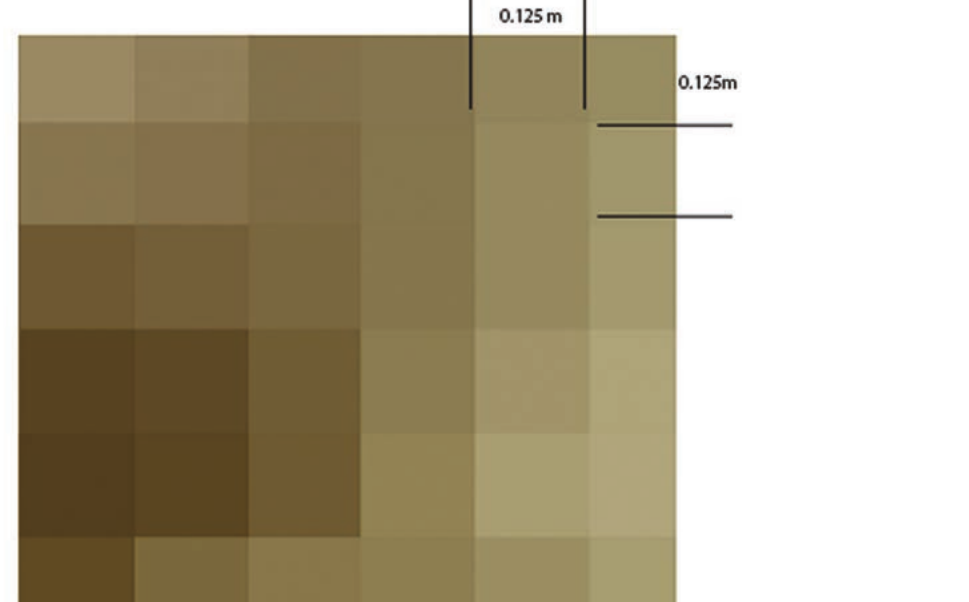
When we zoom into a raster image, we eventually see individual squares or pixels. The size of each pixel determines how much detail we can capture. For example, if each pixel represents 12.5 cm × 12.5 cm on the ground, we can distinguish between objects that are at least this size apart.
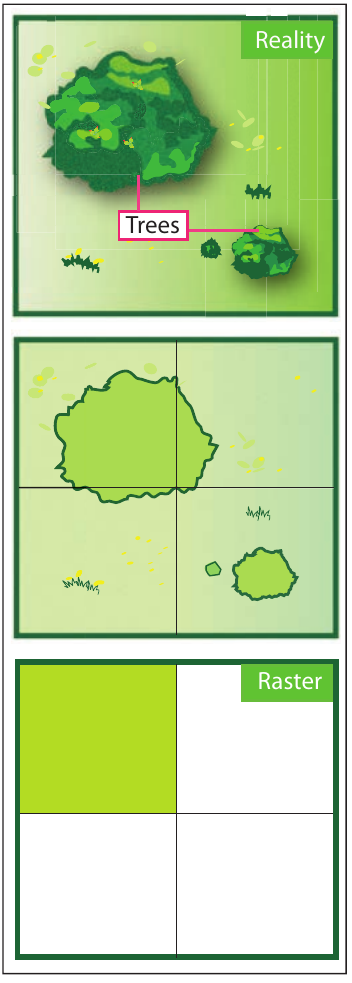
The minimum mapping unit is the smallest area that can be detected by the system. If we're mapping wetlands and our system can only detect areas larger than 1 hectare, then smaller wetland patches will be missed or absorbed into larger features.
Spatial resolution in vector data
Vector data uses a different approach to resolution. Instead of pixels, vector data uses points, lines and polygons to represent geographical features. The resolution here is called the minimum mapping unit or accuracy.
Vector Resolution Comparison
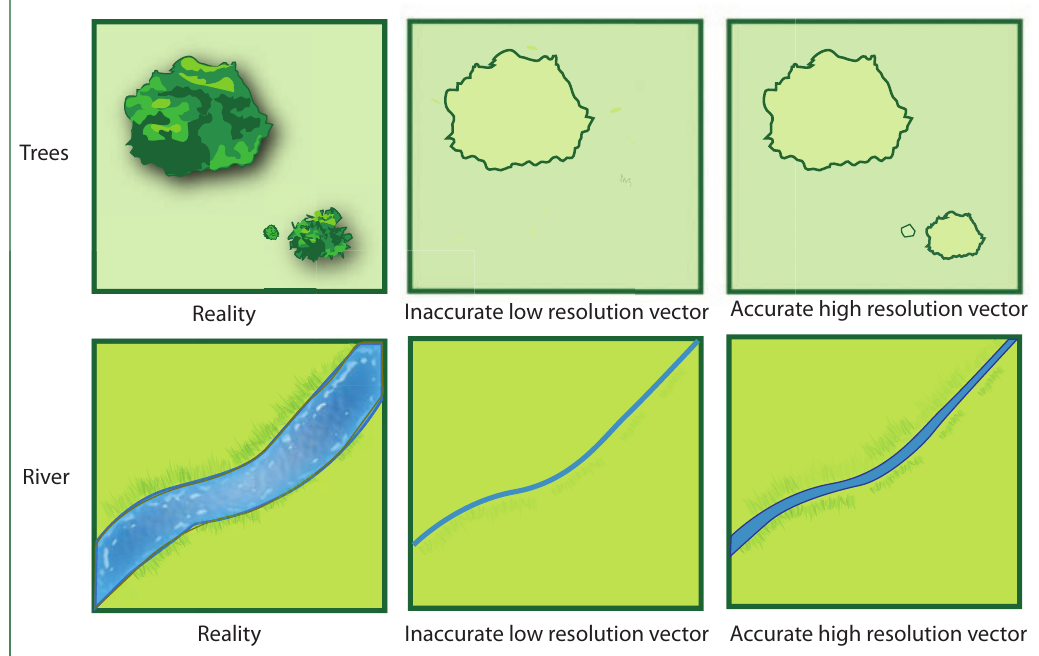
This diagram shows how the same features (trees and a river) can be represented with different levels of accuracy:
- Low resolution vector data: Simple shapes that roughly show where features are located
- High resolution vector data: Detailed outlines that closely match the real-world features
For vector data, we can easily zoom in and out without losing quality, but the underlying accuracy depends on how precisely the original data was collected.
Choosing the right resolution
Higher resolution data provides more detail but comes with costs:
Resolution Trade-offs
Higher resolution data requires:
- Memory requirements: High resolution files are much larger
- Processing power: Detailed data takes more time to analyse
- Internet bandwidth: Large files take longer to download and share
Always balance detail needs with practical limitations!
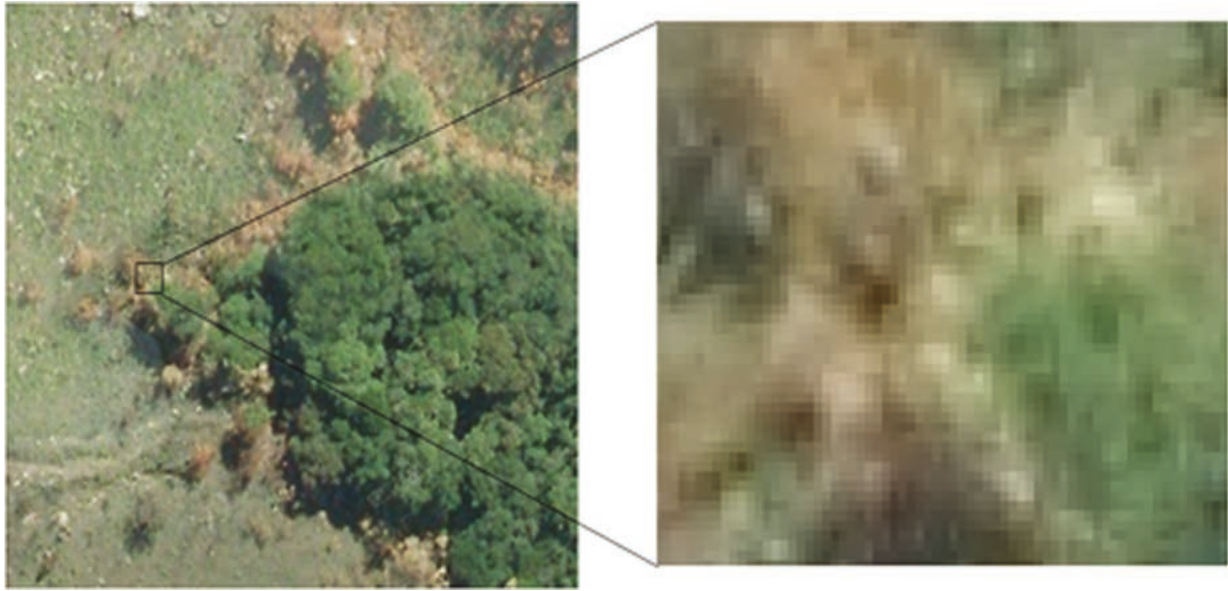
This comparison shows the same area captured at different resolutions. The left image shows fine details of crop fields, while the right image shows the same area in a more pixelated, lower resolution format.
We usually need to find a balance between having enough detail for our purpose and keeping file sizes manageable.
Understanding spectral resolution
Spectral resolution refers to how many different parts of the light spectrum a sensor can detect and measure. Think of the light spectrum as a rainbow - spectral resolution determines how many different colours (or wavelengths) our sensor can distinguish.
The Light Spectrum Analogy
Imagine the light spectrum as a rainbow with infinite colours blending into each other. Spectral resolution determines how many distinct "slices" of this rainbow our sensor can measure separately. More slices mean better ability to identify different materials on Earth's surface.
How spectral sensors work
Earth observation sensors capture information by measuring light reflected from the Earth's surface. This light contains different wavelengths, and different materials reflect different wavelengths in unique ways.
Normal Camera vs. Satellite Sensors
A normal camera captures three bands of light:
- Red wavelengths
- Green wavelengths
- Blue wavelengths
This gives relatively low spectral resolution because it only samples a small part of the available light spectrum, and each band covers a wide range of wavelengths.
High spectral resolution sensors
At the other extreme, hyperspectral sensors can capture up to 256 different bands across a much wider section of the light spectrum. Each band is much narrower, giving much higher spectral resolution.
This high spectral resolution allows scientists to:
- Identify different types of vegetation
- Detect soil composition
- Monitor water quality
- Identify minerals and geological features
Choosing appropriate spectral resolution
Remote sensing specialists choose sensors based on what they need to detect. They select sensors that can measure the specific wavelengths needed to identify the features or phenomena they're studying.
Spectral Resolution Applications
- Agriculture: Moderate spectral resolution to distinguish crop types and health
- Geology: High spectral resolution to identify different minerals
- General mapping: Low spectral resolution may be sufficient for basic land cover classification
Practical applications and examples
Coastal mapping example
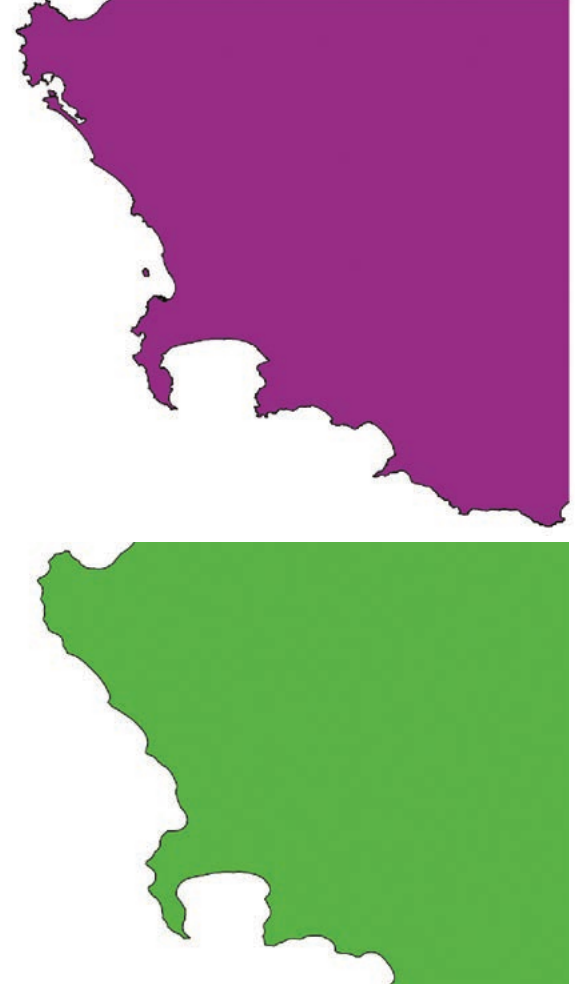
Coastal Mapping Resolution Choices
When mapping coastlines, resolution choice depends on the purpose:
- Detailed coastal studies: High resolution vector data with many vertices to show every inlet and bay accurately
- World maps: Low resolution with simplified coastlines showing just the general continental shapes
Agricultural monitoring
Satellite images of farmland demonstrate resolution trade-offs clearly. High resolution images can show individual plants and field boundaries, while lower resolution images show general crop patterns across larger areas.
Memory and processing considerations
Resource Requirements Increase with Resolution
As resolution increases:
- File sizes grow significantly
- Processing time increases
- More computer memory is required
- Internet transfer speeds become more important
For web-based mapping applications, we often start with lower resolution data and load higher resolution details as users zoom in to specific areas.
Key definitions
Essential Terms to Remember
- Spatial resolution: The level of detail in geographical data, determined by pixel size (raster) or minimum mapping unit (vector)
- Spectral resolution: The number and width of spectral bands that a sensor can detect
- Pixel: The smallest unit of raster data storage
- Feature: A spatial entity in GIS that represents something in the real world
- Minimum mapping unit: The smallest area that can be accurately mapped at a given scale
Remember!
Key Points to Remember
- Spatial resolution determines how much detail you can see - smaller pixels or mapping units give more detail
- Spectral resolution determines how many different wavelengths of light are measured - more bands give better material identification
- Higher resolution always means larger file sizes and greater computing requirements
- Choose resolution based on your purpose - don't always go for the highest resolution available
- Raster data uses pixel size while vector data uses minimum mapping unit to describe spatial resolution