Spatially Referenced Data (Grade 11 NSC Matric Geography): Revision Notes
Spatially Referenced Data
What is spatially referenced data?
Data refers to information that is stored, sorted and produced by a computer. When we talk about spatially referenced data, we mean information that is linked to a specific location or place on Earth. This is different from non-spatial data, which has no connection to location.
As soon as data includes an indication of location (like coordinates), we can say the data is spatially referenced. This location information is typically provided through geographic co-ordinates, which act like an address system for anywhere on Earth.
The key difference between spatial and non-spatial data lies in whether the information can be linked to a specific place or location on Earth's surface.
Forms of data storage
Geographic information can be stored and displayed in several different ways. Understanding these formats helps us work with spatial data effectively.
The same location information can be presented as:
- Text files: Simple lists showing longitude, latitude, identification numbers and place names
- Spreadsheets: Data organised in rows and columns, making it easy to sort and analyse
- Images (pictures): Aerial photographs or satellite imagery showing the actual landscape
- Binary files: Computer-encoded data that humans cannot read directly (like .shp, .shx, .dbf files)
- Database tables: Structured data with geometry information and descriptive details
- Maps: Visual representations showing spatial relationships and locations
Each format serves different purposes, but they all contain the same fundamental location information.
Binary data is encoded computer data that a human can't read directly. Images and several GIS data formats are normally stored as binary data, which requires special software to interpret and display.
Geographic co-ordinates system
Geographic co-ordinates use latitude and longitude to define any position on Earth's surface. Think of them as a global addressing system that works like a grid.
Understanding coordinates
- Latitude lines run horizontally (east-west) and measure distance north or south from the equator
- Longitude lines run vertically (north-south) and measure distance east or west from the Prime Meridian
- Together with a radius, these angles define a position on a spheroid (Earth's slightly flattened sphere shape)
A spheroid is a shape that approximates a sphere. Earth is a slightly unevenly "squashed" sphere, which is why we use a spheroid rather than a perfect sphere for mapping coordinates.
Coordinate formats
Geographic coordinates can be expressed in two main ways:
- Degrees, Minutes, Seconds (DMS): For example, 33°40'09.768"S 19°26'00.456"E
- Decimal Degrees (DD): For example, -33.66938°, 19.43346°
Coordinate Format Examples:
DMS Format: 33°40'09.768"S 19°26'00.456"E
- 33 degrees, 40 minutes, 09.768 seconds South
- 19 degrees, 26 minutes, 00.456 seconds East
Decimal Degrees Format: -33.66938°, 19.43346°
- Negative latitude indicates South
- Positive longitude indicates East
In coordinate pairs, longitude is usually written before latitude. For example: 19.43346, -33.66938.
Exam tip: Remember that negative values indicate South (for latitude) or West (for longitude). Longitude comes before latitude in coordinate pairs.
GIS and spatially referenced data
A Geographic Information System (GIS) gives us the ability to visualise and analyse spatially referenced data effectively. GIS works by combining:
- Spatial components: The location information (coordinates)
- Non-spatial components: Descriptive information called attributes or "fields"
This combination creates what we can call a "graphically-enriched database" or a "data-enriched graphics system". In simple terms, GIS connects maps with descriptive data, allowing us to ask questions like "What is at this location?" and "Where can I find this type of feature?"
Attributes are also known as "fields" or "columns" - they are the descriptive characteristics that make up a record in a GIS and describe a feature's properties.
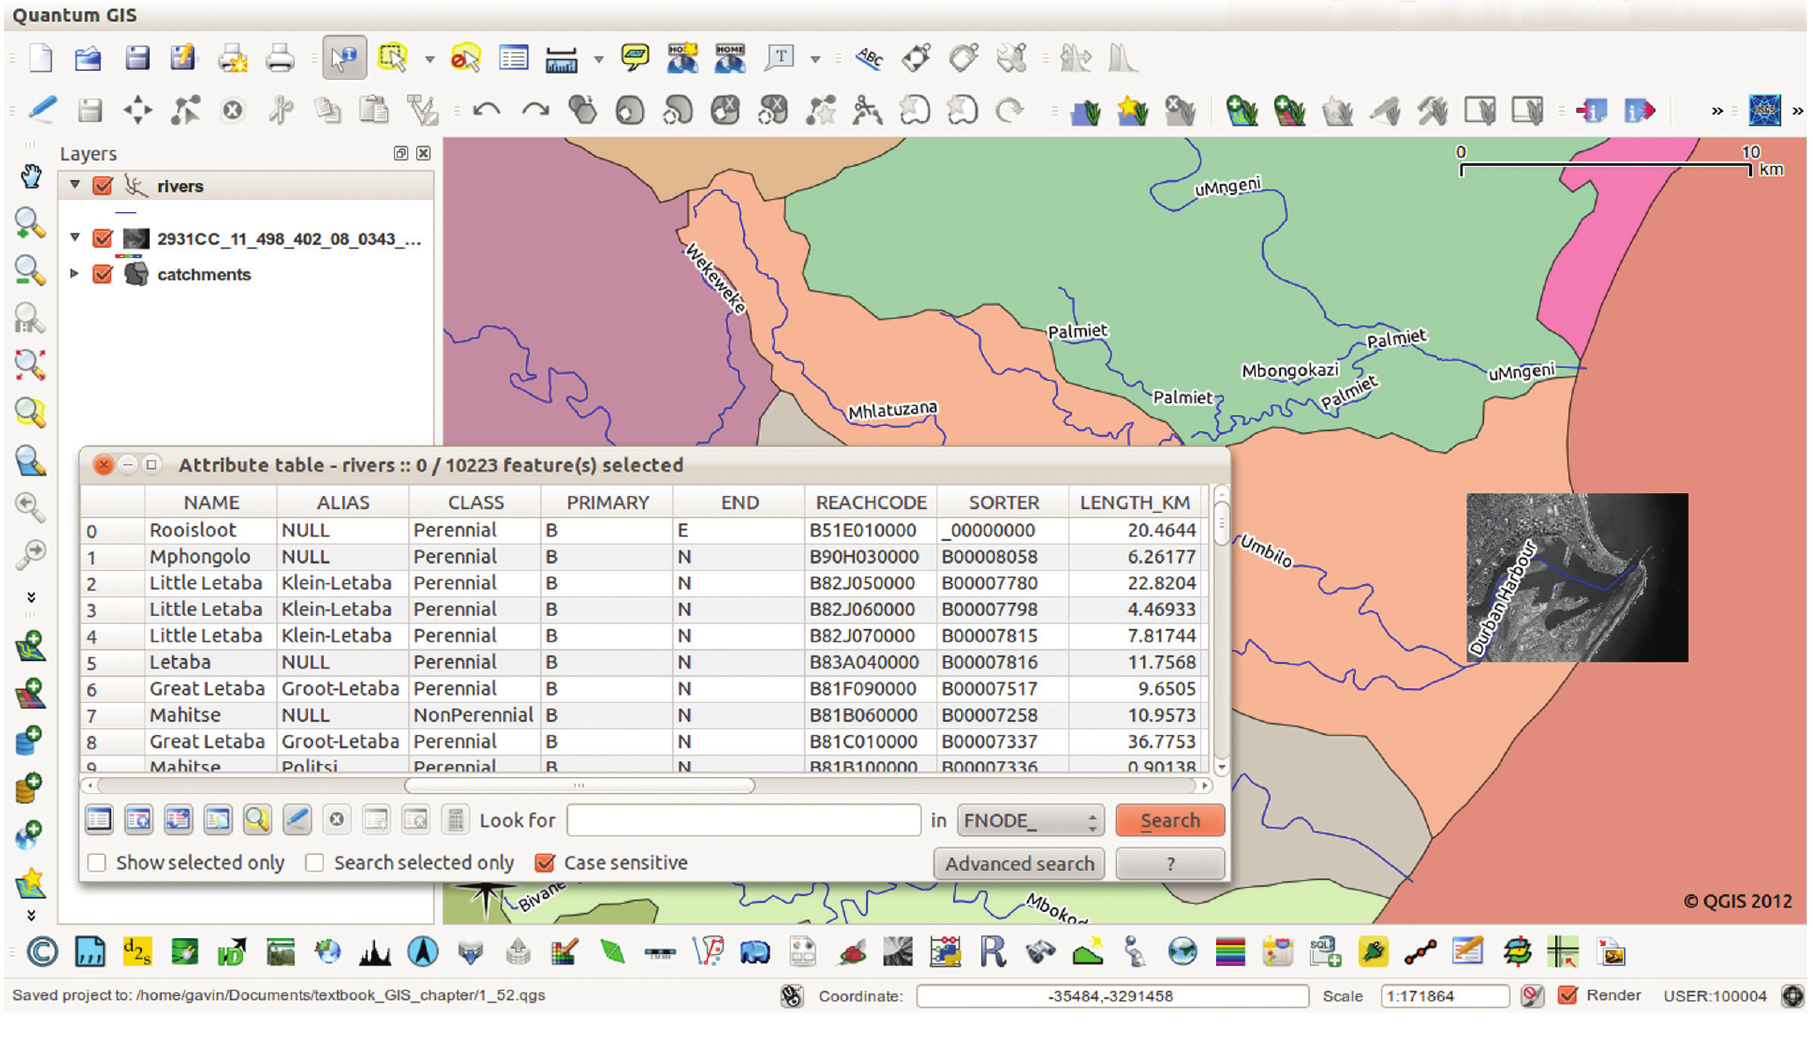
How GIS works
GIS displays the same dataset in two ways:
- As a map showing spatial relationships and patterns
- As an attribute table containing detailed information about each feature
This dual representation makes GIS incredibly powerful for geographic analysis, planning, and decision-making.
The power of GIS lies in its ability to link spatial information (where something is) with attribute information (what something is), enabling complex spatial analysis and decision-making.
Remember!
Key Points to Remember:
- Spatially referenced data includes location information, while non-spatial data does not
- Geographic coordinates use latitude and longitude to identify any place on Earth
- Data can be stored in multiple formats (text, spreadsheet, images, binary files, databases, maps)
- GIS combines spatial and non-spatial data to create powerful analysis tools
- Longitude comes before latitude in coordinate pairs
- Coordinates can be expressed as DMS (degrees, minutes, seconds) or decimal degrees
- Negative coordinate values indicate South (latitude) or West (longitude)