Scale (Grade 11 NSC Matric Geography): Revision Notes
Scale
Scale is one of the most important concepts in mapwork that helps us understand the relationship between what we see on a map and the real world. Think of scale as a "shrinking factor" - it tells us exactly how much the real world has been reduced to fit on a piece of paper.
Understanding scale is fundamental to reading any map correctly. Without scale, a map would be completely useless because we wouldn't know the real distances between places!
What is scale?
Scale shows us the relationship between the actual geographical area on the ground and the size of that same area as it appears on the map. Every map must have a scale because without it, we wouldn't know if a line represents 1 metre or 1 kilometre in real life!
Every map MUST have a scale - this is not optional! A map without a scale is like a ruler without numbers - it tells us nothing about real distances.
Types of scale representation
There are three main ways that cartographers (map makers) can show scale on maps. Each method gives us the same information but presents it differently.
Word or statement scale
This type of scale is written as a simple sentence that directly explains the relationship. For example, "1 cm on the map represents 500 m on the ground" tells us exactly what each centimetre on the map equals in real life. This is the easiest type of scale for beginners to understand because it uses plain language.
Word scales are perfect for beginners because they use everyday language. There's no math to figure out - the relationship is stated clearly in words you already understand!
Representative fraction (RF) or ratio scale
This scale compares a unit of measurement on the map with the same unit of measurement on the ground. You'll see this written as ratios like 1:50 000 or as fractions like 1/50 000. Both mean exactly the same thing - that 1 cm on the map represents 50 000 cm (which equals 500 m or 0.5 km) on the ground.
Most South African topographic maps use a ratio scale of 1:50 000, whilst orthophoto maps typically use 1:10 000. Remember that a scale of 1:1 would mean the map is the same size as reality - which would be completely impractical!
Worked Example: Converting Ratio Scale to Real Distance
Given: Map scale of 1:50 000 Question: If two points are 3 cm apart on the map, what is the real distance?
Step 1: Understand what the scale means
- 1:50 000 means 1 cm on map = 50 000 cm on ground
Step 2: Calculate the real distance
- Map distance = 3 cm
- Real distance = 3 cm × 50 000 = 150 000 cm
Step 3: Convert to more useful units
- 150 000 cm = 1 500 m = 1.5 km
Answer: The real distance is 1.5 km
Line scale or bar scale
This scale appears as a visual ruler or bar on the map that shows distances. You can measure distances directly by comparing them to this scale bar. It's particularly useful because it remains accurate even if the map is photocopied or enlarged.

Line scales are incredibly practical! Even if someone photocopies your map and makes it bigger or smaller, you can still measure accurate distances using the line scale because it changes size along with the rest of the map.
Understanding small-scale versus large-scale maps
This concept often confuses students, but there's a simple way to remember the difference.
Memory Aid for Scale Types:
- Large scale = Large detail, Small area
- Small scale = Small detail, Large area
- Bigger denominator = Smaller scale
Large-scale maps
A large-scale map shows a smaller area with greater detail. These maps have larger representative fractions (like 1:10 000). Think of "zooming in" - you see less area but much more detail about buildings, roads, and local features.
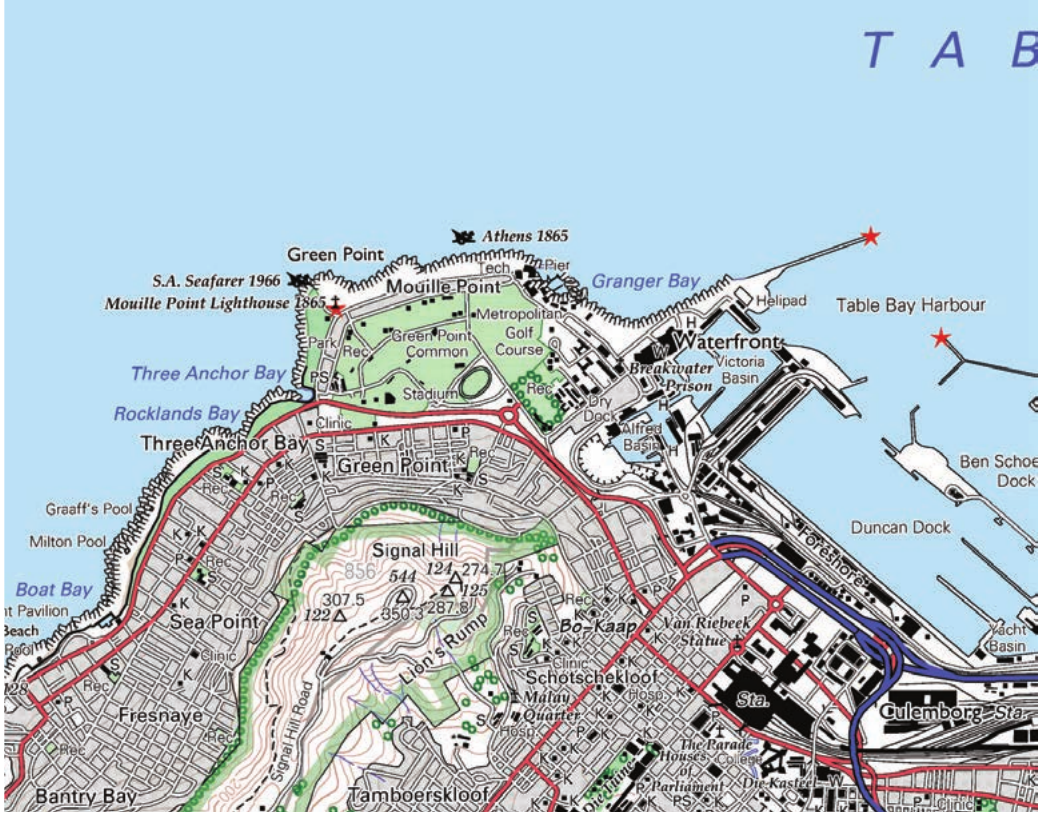
The topographic map of Cape Town above shows detailed street layouts, individual buildings, and specific landmarks like the stadium and harbour areas.
Small-scale maps
A small-scale map shows a larger area with less detail. These maps have smaller representative fractions (like 1:50 000 or 1:250 000). Think of "zooming out" - you can see a much wider area but with less specific detail.
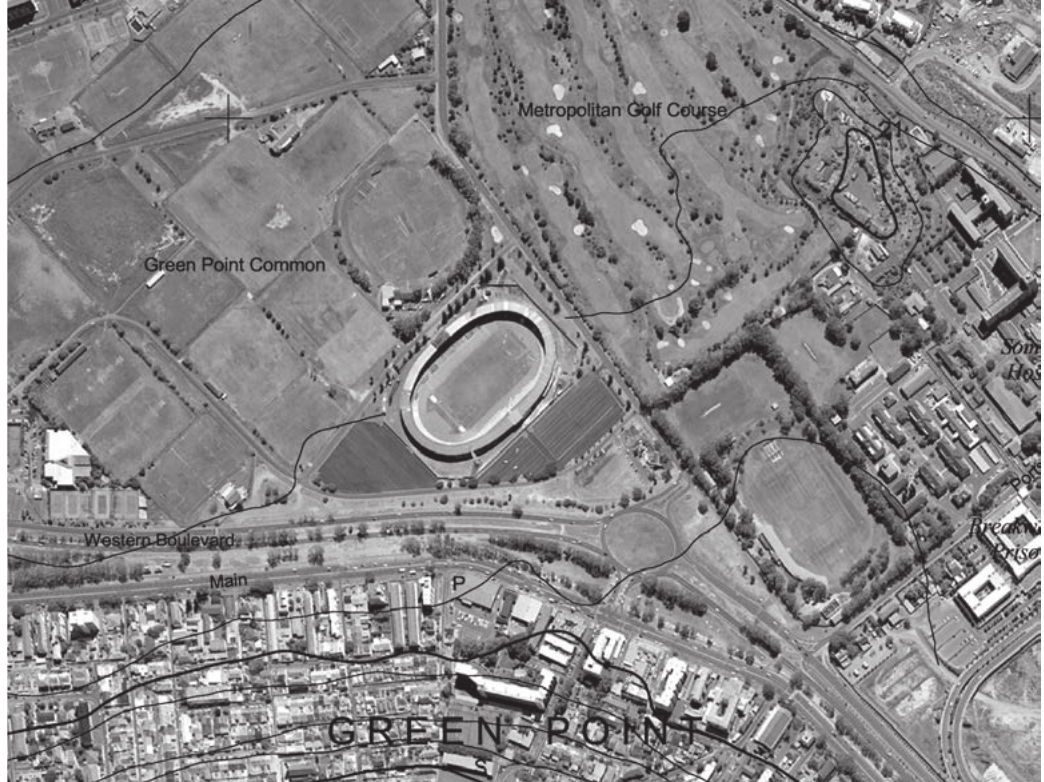
The orthophoto map shows the same Cape Town area but captures a broader view with less street-level detail.
Comparing scales
When comparing scales, remember this important rule: the larger the number in the ratio scale, the smaller the scale of the map. For example:
- is a larger scale than
- This means
The map with the 1:10 000 scale will show more detail but cover less area than the map with the 1:50 000 scale.
Critical Rule for Scale Comparison: When you see larger numbers in the denominator (bottom of the fraction), you're looking at a SMALLER scale map. Think of it like this: is a smaller fraction than , so 1:50 000 is a smaller scale than 1:10 000.
Key terminology
Scale: The relationship between distances on a map and corresponding distances on the ground
Word scale: A scale expressed as a sentence describing the map-to-ground relationship
Representative fraction (RF): A scale showing the ratio between map distance and ground distance using the same units
Line scale: A visual scale bar that allows direct measurement of distances on the map
Large-scale map: Shows greater detail of a smaller area (larger representative fraction)
Small-scale map: Shows less detail of a larger area (smaller representative fraction)
Key Points to Remember:
- Scale tells us how much the real world has been shrunk down to fit on a map
- There are three ways to show scale: word, ratio, and line scales - all give the same information
- Large-scale maps = Large detail, Small area (like 1:10 000)
- Small-scale maps = Small detail, Large area (like 1:50 000)
- The bigger the denominator in a ratio scale, the smaller the scale of the map