Using Atlases (Grade 11 NSC Matric Geography): Revision Notes
Using and Comparing Map Information
Understanding how to use and compare different types of maps is a crucial geographical skill. Maps contain vast amounts of information, and learning to extract, interpret, and compare this data helps us understand spatial patterns and relationships around the world.
Understanding coordinate systems and grid references
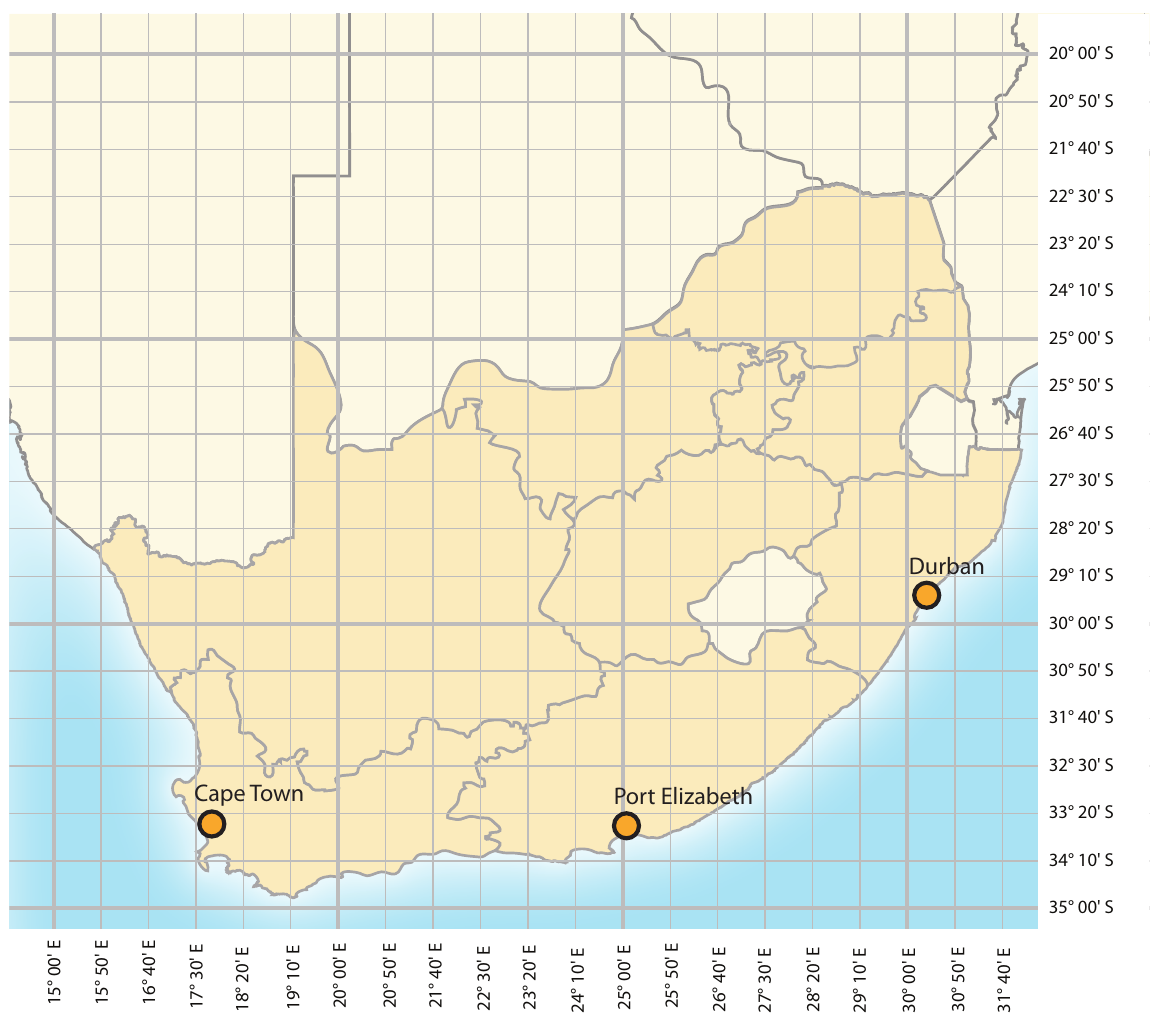
Maps use coordinate systems to help us locate places precisely. The most common system uses latitude and longitude, which create a grid of intersecting lines across the Earth's surface.
Understanding the Grid System
Think of the Earth's coordinate system like a giant game of battleships - every location has a unique "address" that can be found using the intersection of latitude and longitude lines.
Latitude lines run horizontally (east to west) and measure distance north or south of the Equator. They are numbered from at the Equator to at the poles, with 'N' for north and 'S' for south.
Longitude lines run vertically (north to south) and measure distance east or west of the Prime Meridian. They range from to , with 'E' for east and 'W' for west.
Coordinate Format
When reading coordinates, the format typically shows latitude first, then longitude (e.g., ). Remember: "Latitude lines lie flat" (horizontal) and "Longitude lines are long" (vertical).
This system allows us to pinpoint any location on Earth with remarkable accuracy. For example, major South African cities can be located using their precise coordinates, making it possible to find them on any world map or atlas.
Types of thematic maps
Atlases contain various thematic maps that display specific types of information about our world. Each type reveals different patterns and helps us understand various geographical phenomena.
Climate maps
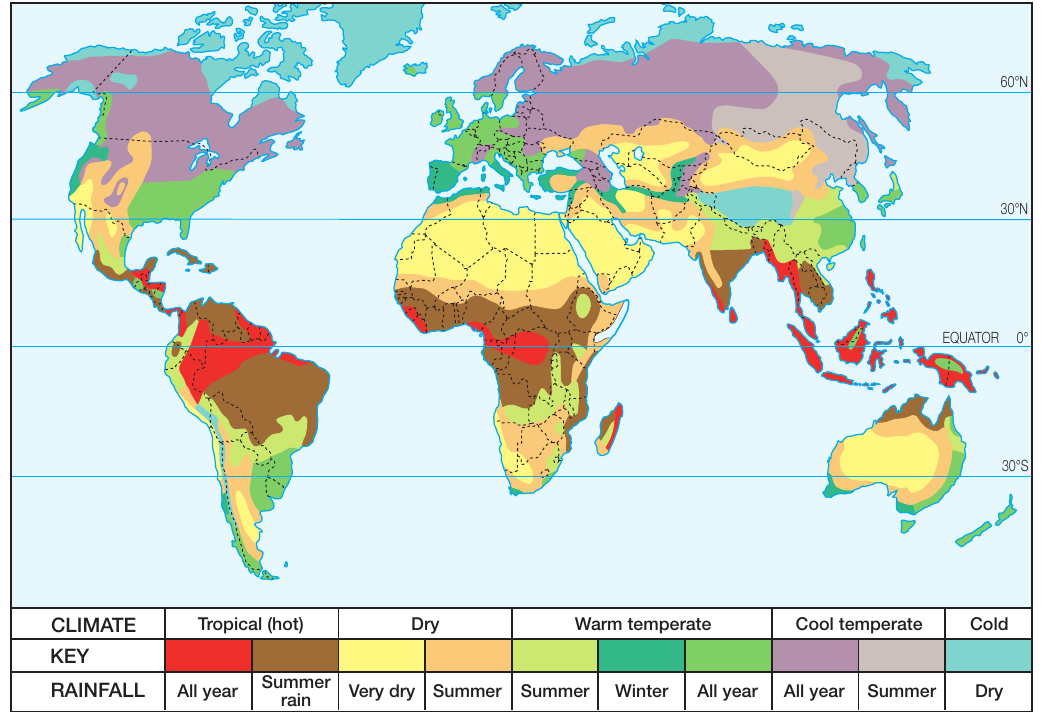
Climate maps show the distribution of different climate zones across the world. These maps typically use colour coding to represent various climate types, such as tropical hot, dry, warm temperate, cool temperate, and cold regions.
Reading Climate Patterns
Climate zones generally follow latitude patterns - areas near the equator tend to be hot and tropical, while regions closer to the poles are colder. This pattern helps explain global weather systems and seasonal variations.
Climate maps also indicate rainfall patterns, showing whether regions receive precipitation all year round, mainly in summer, mainly in winter, or are very dry. Understanding these patterns helps explain why certain areas support different types of vegetation, agriculture, and human settlement.
Natural disaster maps
These specialised maps show where different types of natural hazards occur around the world. They might display earthquake zones, hurricane paths, volcano locations, and areas prone to flooding. Understanding these patterns is crucial for disaster preparedness and risk assessment.
Population density maps
Population maps reveal how people are distributed across the Earth's surface. They use different colours and symbols to show areas of high, medium, and low population concentration.
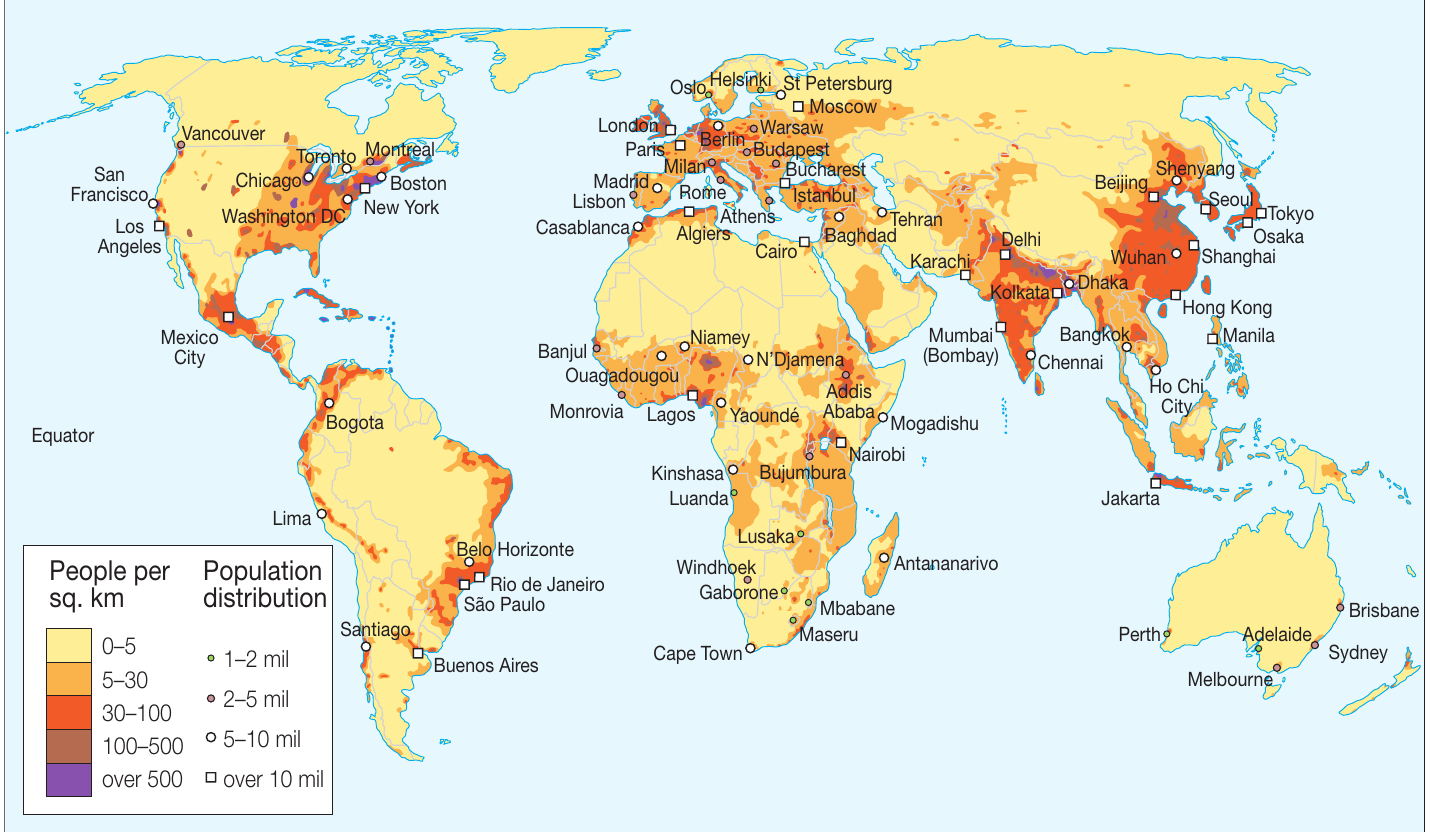
Population density is typically measured in people per square kilometre, with categories ranging from very sparse ( people per sq. km) to extremely dense (over people per sq. km). Major cities are often marked with symbols indicating their population size.
Population Density Categories
- Very sparse: 0-5 people per sq. km (rural areas, deserts, mountains)
- Sparse: 5-30 people per sq. km (farming regions, small towns)
- Medium: 30-100 people per sq. km (suburban areas)
- Dense: 100-500 people per sq. km (urban areas)
- Very dense: Over 500 people per sq. km (major cities, metropolitan areas)
Skills for comparing different maps
Comparing information from multiple maps allows us to identify relationships and correlations between different geographical phenomena. This process involves several important steps.
Extracting information systematically
When working with multiple maps, it's helpful to create comparison tables that organise information clearly. You might compare cities based on their latitude, climate region, natural disaster risks, and population density.
Worked Example: City Comparison Table
| City | Latitude | Climate region | Natural disasters | Population density |
|---|---|---|---|---|
| Addis Ababa | ||||
| San Francisco | ||||
| Osaka | ||||
| Melbourne |
Step 1: Use the coordinate grid to find each city's latitude
Step 2: Check the climate map to identify the climate region
Step 3: Consult disaster maps to identify potential hazards
Step 4: Use population maps to determine density levels
Looking for patterns and relationships
Once you've extracted information from different maps, look for connections between the data. For example:
- Latitude and climate: Places closer to the Equator tend to have warmer climates, while those nearer the poles are cooler
- Climate and population: Areas with moderate climates often support higher population densities than extremely hot, cold, or dry regions
- Natural disasters and development: Understanding disaster risks helps explain why some areas are less densely populated
Analysing correlations
Understanding Correlation
A correlation exists when two factors appear to be related. For instance, you might notice that areas with high population density tend to face greater impacts from natural disasters, not because the disasters are worse, but because more people are affected when they occur.
Practical applications
These map comparison skills have real-world applications in many fields:
- Urban planning: Understanding climate, population, and disaster risks helps planners make better decisions about where to build cities and infrastructure
- Agriculture: Climate and population maps help determine suitable crop types and food distribution needs
- Emergency management: Combining natural disaster and population maps helps prioritise disaster preparedness efforts
- Business location: Companies use various map data to decide where to establish operations
Developing your skills
Building Your Map Skills
To become proficient at using and comparing map information:
- Practice reading coordinates until you can quickly locate places using latitude and longitude
- Learn to identify symbols and legends on different types of thematic maps
- Look for patterns rather than just isolated facts when examining maps
- Ask questions about relationships between different types of geographical information
- Use multiple sources to verify and cross-check information
Key Points to Remember:
- Coordinates help locate places precisely - latitude measures north/south, longitude measures east/west
- Thematic maps show specific information - climate, population, natural disasters, and other geographical phenomena
- Comparing different maps reveals relationships - look for correlations between climate, population, and other factors
- Systematic comparison is key - use tables and organised approaches to extract and compare information
- Map skills have practical applications - from urban planning to disaster management and business decisions