Ogives (Grade 11 NSC Matric Mathematics): Revision Notes
Ogives
What are ogives?
An ogive is a special type of graph, also called a cumulative histogram. These graphs help us understand how data is distributed by showing how many values fall above or below any particular point in our dataset.
The key feature of ogives is that they display cumulative frequencies rather than individual frequencies. This means each point on the graph tells us the total count of all data values up to that point.
Cumulative frequency is calculated by adding each frequency to the sum of all frequencies that came before it in the data. The final cumulative frequency will always equal the total number of data values, since we've counted everything.
Calculating cumulative frequencies
Let's work through calculating cumulative frequencies step by step:
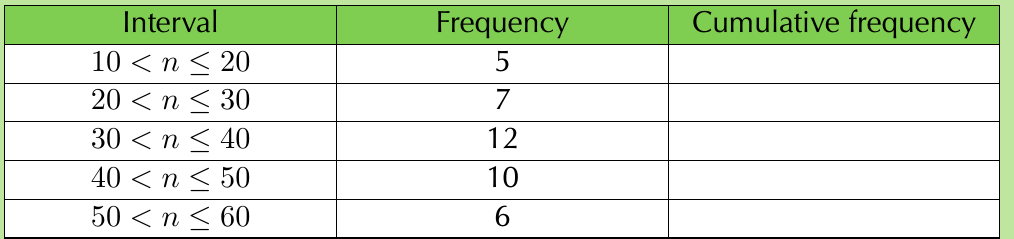
To complete the cumulative frequency column, we add frequencies as we move down the table:
- First interval (): Cumulative frequency = (just the first frequency)
- Second interval (): Cumulative frequency =
- Third interval (): Cumulative frequency =
- Fourth interval (): Cumulative frequency =
- Fifth interval (): Cumulative frequency =
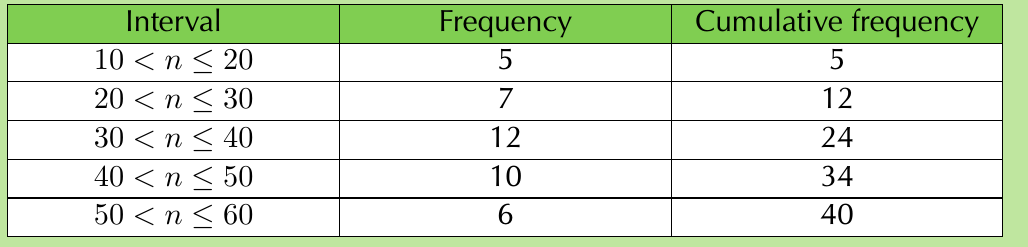
Notice how the cumulative frequency keeps increasing and ends at 40, which is our total number of data values (). Cumulative frequencies should never decrease!
How to plot an ogive
Drawing an ogive follows these specific steps:
- Start at zero: Plot your first point at the beginning of the first interval with a y-value of 0
- Plot cumulative points: At the end of each interval, plot a point with the y-value equal to the cumulative frequency for that interval
- Connect with straight lines: Join all plotted points using straight lines
Let's apply this to our example:
- Start at
- Plot , , , ,
- Connect these points with straight lines
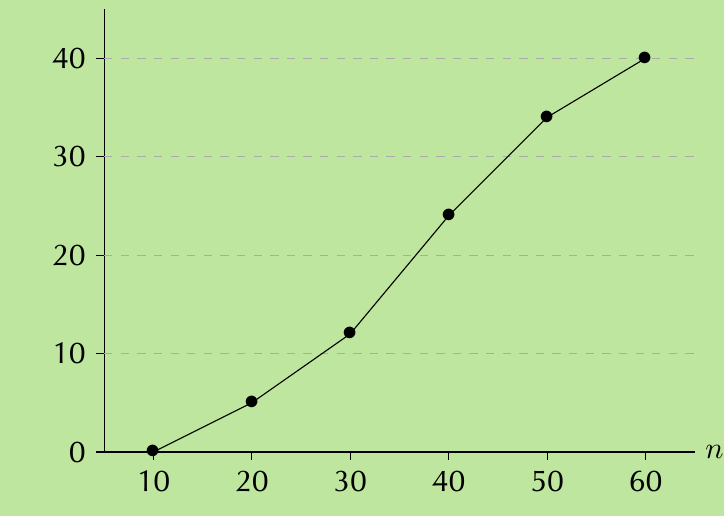
The resulting graph shows our ogive. Notice how it always increases (or stays flat) - it never decreases because we're adding frequencies, not subtracting them.
Using ogives for statistical analysis
Ogives are particularly useful for finding quartiles and creating a five-number summary. The quartiles divide our ordered data into four equal parts:
- First quartile (): The value below which 25% of the data falls
- Second quartile (): The median - 50% of data falls below this value
- Third quartile (): The value below which 75% of the data falls
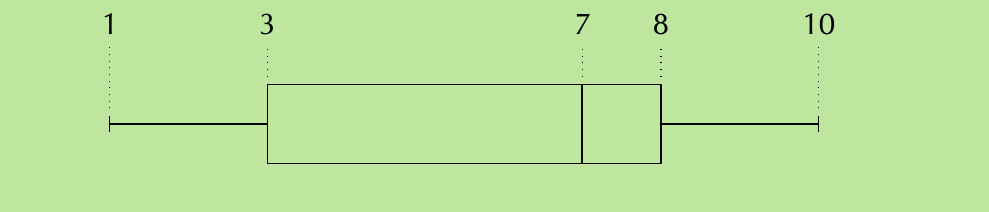
Worked Example: Finding the Five-Number Summary
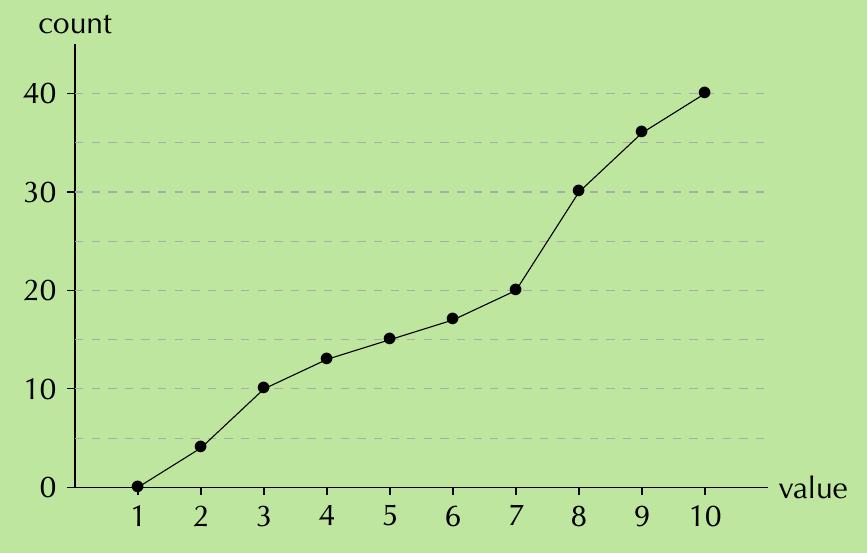
Using this ogive, we can find our five-number summary:
Step 1: Find the minimum and maximum
- Minimum: Where the ogive starts on the horizontal axis = 1
- Maximum: Where the ogive ends on the horizontal axis = 10
Step 2: Find the quartiles The total count is 40, so:
- is at count =
- (median) is at count =
- is at count =
Reading from the ogive:
- Count of 10 corresponds to value = 3 ()
- Count of 20 corresponds to value = 7 ()
- Count of 30 corresponds to value = 8 ()
Step 3: Write the five-number summary
Five-number summary: (1; 3; 7; 8; 10)
Key differences from frequency polygons
While ogives might look similar to frequency polygons, there's an important distinction:
- Frequency polygons plot individual frequency values
- Ogives plot cumulative frequency values
To convert from a frequency polygon to an ogive, you would add up the frequencies as you move from left to right across the graph.
Exam Tips
- Always start your ogive at the beginning of the first interval with
- The final point should always equal your total sample size
- Use the ogive to read off quartile values by finding the appropriate fractions of your total count
- Check that your cumulative frequencies are always increasing (never decreasing)
- When finding quartiles, remember to look at the count on the y-axis first, then read across to find the corresponding value
Key Points to Remember:
- Ogives show cumulative frequencies - they tell us how many data values fall below any given point
- Cumulative frequencies always increase as we move through the intervals
- Start plotting at zero at the beginning of the first interval
- Use ogives to find quartiles by locating , , and of the total count
- The five-number summary consists of minimum, , median (), , and maximum values