What Is a Synoptic Weather Map? (Grade 12 NSC Matric Geography): Revision Notes
What is a Synoptic Weather Map?
Understanding synoptic weather maps
A synoptic weather map is a crucial tool that meteorologists use to display weather information across large geographical areas. These maps present a snapshot of weather conditions at a specific moment in time, showing various atmospheric elements like temperature, rainfall, wind patterns, air pressure, and cloud coverage. The information comes from multiple sources including weather monitoring stations, aircraft observations, weather balloons, and satellite data, all collected simultaneously to create an accurate picture of current weather conditions.
Synoptic weather maps are essential because they provide meteorologists with a comprehensive view of weather patterns across vast areas, enabling accurate weather forecasting and the tracking of significant weather systems.
These weather maps are essential for understanding weather patterns and predicting future weather conditions. In South Africa, synoptic weather maps help forecasters track important weather systems like tropical cyclones, cold fronts, and pressure systems that influence the country's climate throughout the year.
Key components of synoptic weather maps
Isobars and pressure systems
One of the most important features you'll notice on any synoptic weather map are curved lines called isobars. These lines connect areas that have identical atmospheric pressure readings, similar to how contour lines on a topographic map connect points of equal elevation. The pressure measurements are recorded in either hectopascals (hPa) or millibars (mb), with both units being equivalent.
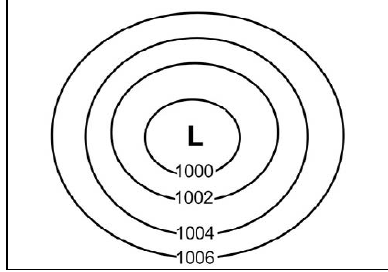
Understanding pressure systems is crucial because they directly influence weather conditions and wind behaviour. When isobars form circular or oval patterns, they create pressure systems - areas with "L" represent low pressure systems, while areas marked with "H" indicate high pressure systems.
Weather stations and data collection
Weather stations are positioned throughout South Africa and surrounding areas to collect local weather information. Each station records multiple weather elements simultaneously and displays this data using standardised symbols on synoptic maps.
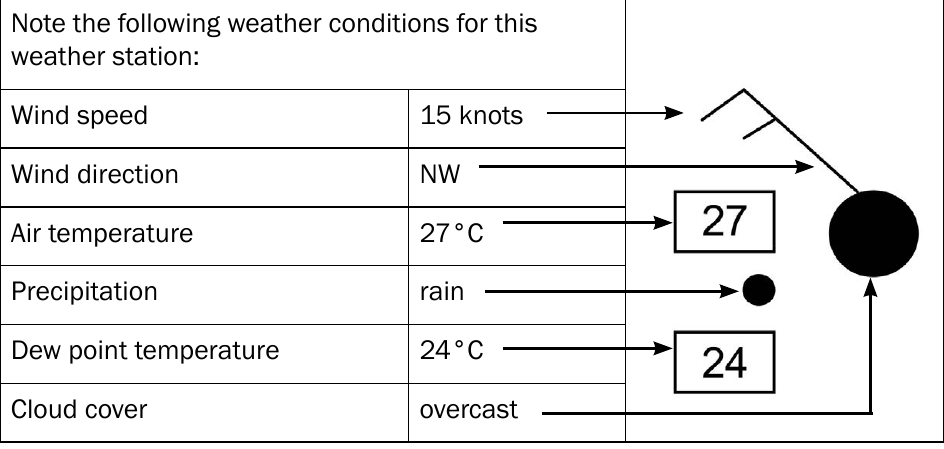
Weather stations record the following information:
- Current air temperature (measured in degrees Celsius)
- Dew point temperature (indicating humidity levels)
- Wind speed (measured in knots)
- Wind direction (using compass directions)
- Current precipitation type (rain, snow, hail, etc.)
- Cloud cover conditions (from clear skies to complete overcast)
Reading weather symbols and interpreting data
Understanding weather symbols
Meteorologists use standardised symbols to represent different weather conditions on synoptic maps. Learning these symbols is essential for interpreting weather station data correctly.
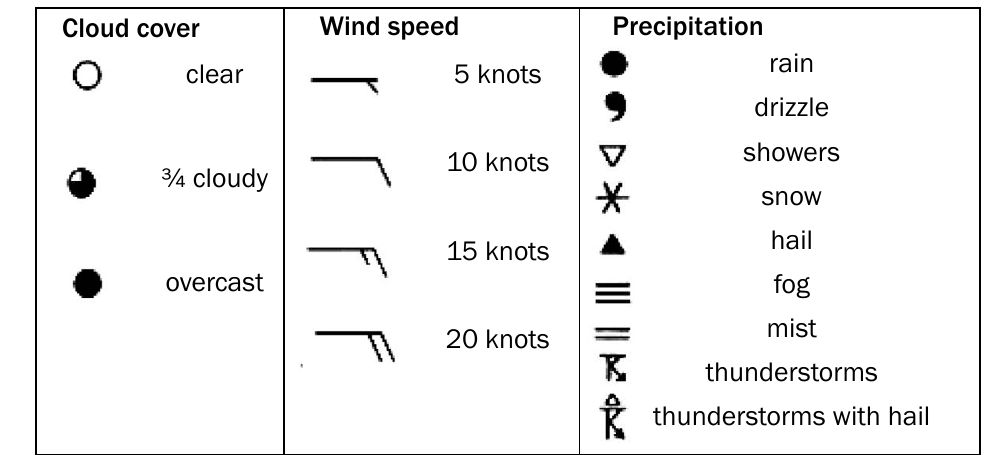
Understanding Cloud Cover Symbols:
- Clear skies are shown with an empty circle ○
- Partly cloudy conditions use a circle that's three-quarters filled ◐
- Overcast conditions are represented by a completely filled black circle ●
Wind speed indicators: Wind speed is displayed using special barb symbols that extend from the weather station location. The more barbs and flags on the symbol, the stronger the wind speed, with measurements progressing from 5 knots up to 20 knots or more.
Precipitation symbols have distinct representations:
- Solid dots for rain
- Curved lines for drizzle
- Triangular shapes for showers
- Asterisk-like symbols for snow
- Triangular symbols for hail
- Horizontal line symbols for fog and mist
- Special lightning-style symbols for thunderstorms
Determining wind direction
Understanding wind direction is crucial when interpreting synoptic weather maps. Wind direction refers to the direction from which the wind is blowing, not where it's going.
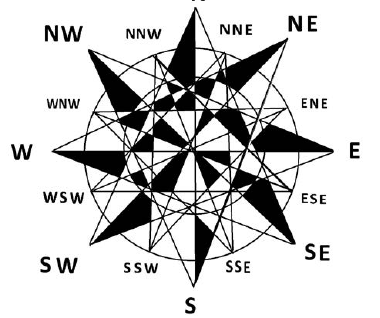
Key concept: Wind direction refers to the direction FROM which the wind is blowing, not where it's going. The wind barbs on weather station symbols point in the direction from which the wind originates.
Using compass directions, winds can blow from any of the main directions (North, South, East, West) or intermediate directions (Northeast, Southeast, Southwest, Northwest).
Seasonal patterns in South African synoptic charts
Summer synoptic weather patterns
During summer months, South African synoptic weather charts typically display characteristic patterns that influence the country's weather conditions.
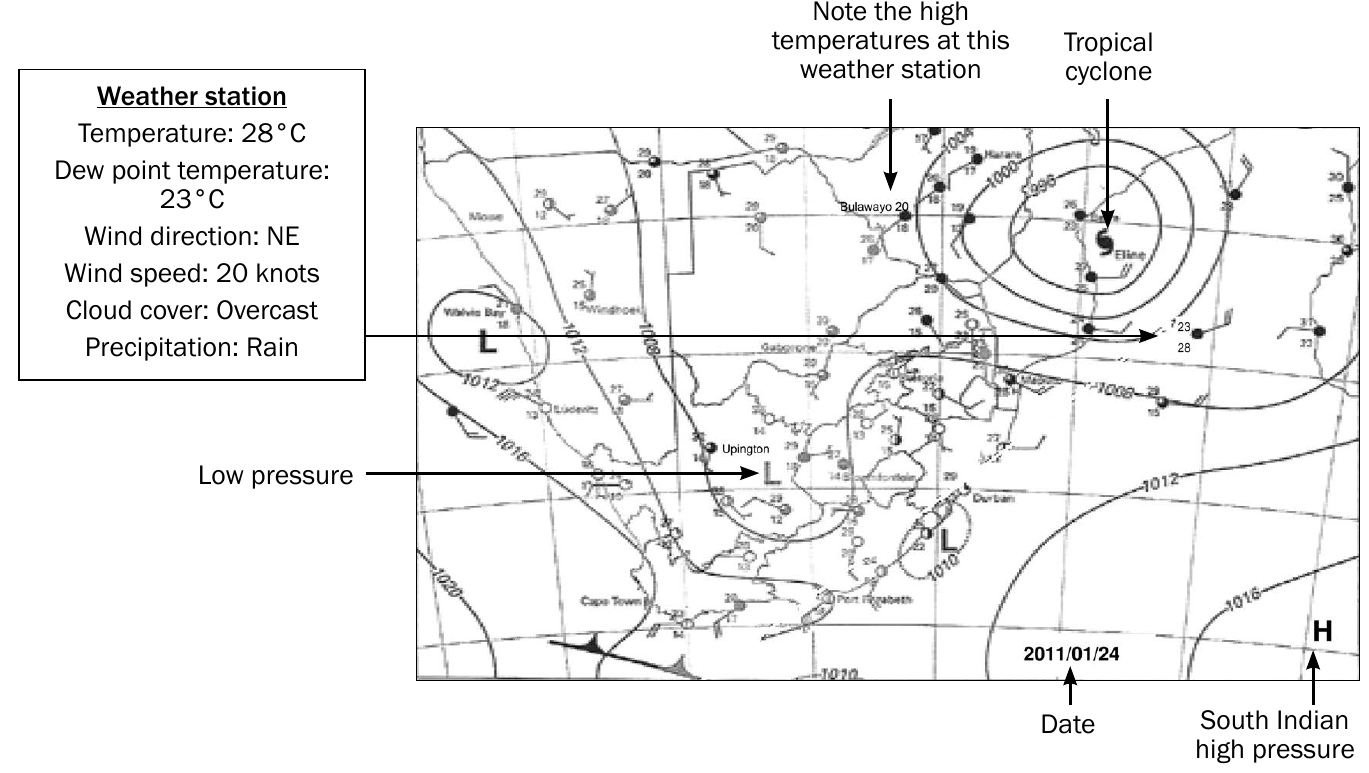
Key features of summer synoptic charts:
- Tropical cyclones may appear in the southwest Indian Ocean, showing as circular isobar patterns
- Low pressure systems commonly develop over the South African landmass
- The South Indian High pressure system is positioned further south and east of the country
- Generally higher temperatures are recorded at weather stations across the land areas
- The date on summer charts typically falls between October and March
Winter synoptic weather patterns
Winter synoptic charts for South Africa show distinctly different patterns compared to summer conditions, reflecting the seasonal shift in atmospheric circulation.
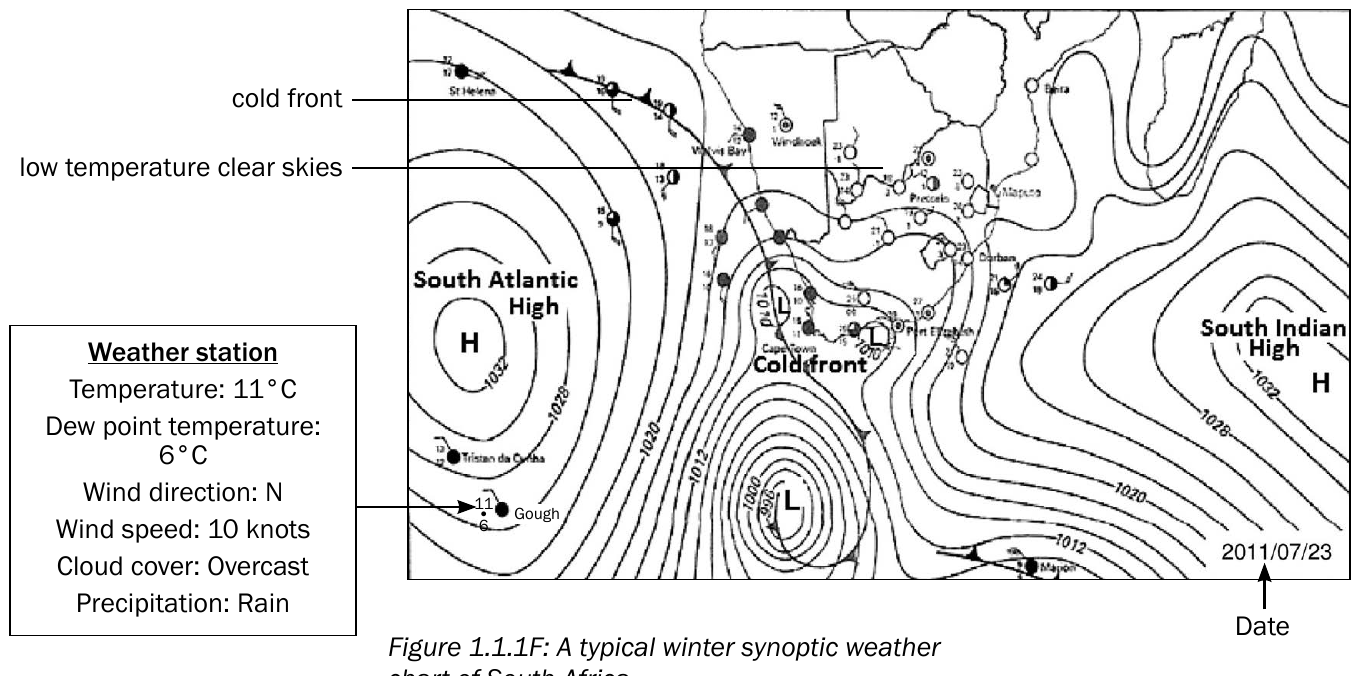
Key features of winter synoptic charts:
- Cold fronts frequently move across South Africa, marked by lines with triangular symbols
- The Kalahari High pressure system dominates over the South African landmass
- Both the South Atlantic High and South Indian High pressure systems move closer to the South African coast
- Generally lower temperatures are recorded at weather stations throughout the country
- Clear skies often follow the passage of cold fronts
- The date on winter charts typically falls between April and September
These seasonal differences in synoptic patterns directly influence South Africa's weather conditions, rainfall patterns, and temperature variations throughout the year.
Key Points to Remember:
-
Synoptic weather maps show weather conditions across large areas at the same moment in time, using data from weather stations, satellites, and other monitoring equipment
-
Isobars are lines connecting points of equal atmospheric pressure, forming patterns that indicate high and low pressure systems marked with "H" and "L"
-
Weather station symbols display multiple weather elements including temperature, wind speed and direction, cloud cover, and precipitation using standardised meteorological symbols
-
Wind direction is determined using compass points and refers to the direction FROM which the wind blows, not where it's going
-
South African synoptic charts show clear seasonal differences - summer patterns feature tropical cyclones and low pressure over land, while winter patterns show cold fronts and high pressure systems over the country