Genetic Lineage (Grade 12 NSC Matric Life Sciences): Revision Notes
Genetic Lineage
What are pedigree diagrams?
A pedigree diagram, also known as a family tree, is a special chart used by geneticists to study how traits are passed down through families across multiple generations. These diagrams help us understand inheritance patterns and predict the likelihood of certain characteristics appearing in future generations.
Pedigree diagrams are incredibly useful tools in genetics because they allow us to track the inheritance of specific traits, from simple characteristics like eye colour to more complex genetic conditions. By studying these family trees, we can determine whether a trait is dominant or recessive, and even identify if it's linked to sex chromosomes.
Pedigree diagrams are not just used for studying genetic disorders - they're also valuable for tracking normal traits like height, eye colour, and blood type patterns in families. This makes them essential tools in both medical genetics and evolutionary biology.
Reading pedigree diagrams
Understanding the symbols and structure of pedigree diagrams is essential for interpreting genetic information correctly.
Basic symbols and conventions
The symbols used in pedigree diagrams follow standard conventions that make them easy to read once you understand the basics:
- Squares represent males - this is the universal symbol for male individuals
- Circles represent females - this is the standard symbol for female individuals
- Horizontal lines connect mating pairs - these show which individuals have reproduced together
- Vertical lines show parent-offspring relationships - these connect parents to their children
Indicating traits
The presence or absence of specific traits is shown through different ways of filling in the symbols:
- Filled/shaded symbols represent individuals who express the trait being studied
- Empty/unfilled symbols represent individuals who do not express the trait
- Half-filled symbols sometimes indicate carriers of recessive traits
Remember that the symbols and their meanings are standardised across all pedigree diagrams, making it easier to interpret genetic information once you learn these basic conventions.
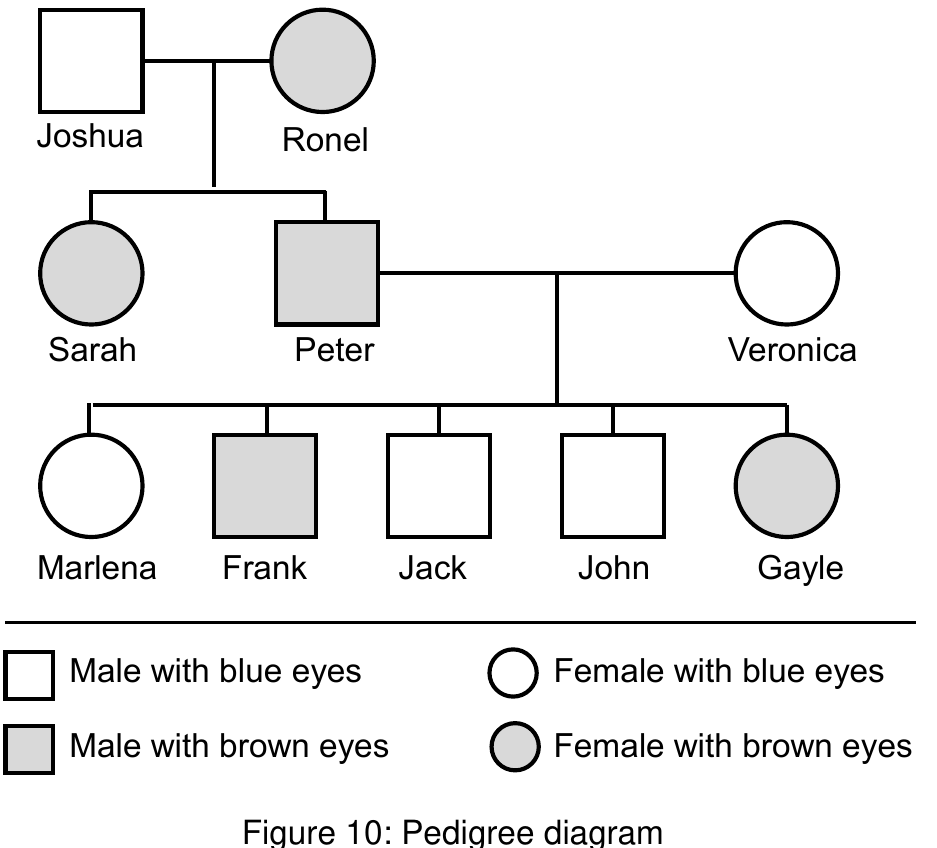
This pedigree diagram demonstrates the inheritance of eye colour across three generations, where brown eyes are dominant over blue eyes.
Step-by-step interpretation of pedigree diagrams
To properly analyse a pedigree diagram, follow this systematic approach:
Worked Example: Six-Step Pedigree Analysis Process
Step 1: Identify the inheritance pattern Start by studying any key information provided and look for clues about whether the trait is dominant or recessive. Pay attention to which individuals express the trait and which do not.
Step 2: Record all phenotypes Write down the observable characteristics (phenotypes) of all individuals shown in the diagram. Note which individuals express the trait and which don't, along with their gender.
Step 3: Determine recessive genotypes Individuals showing a recessive trait must be homozygous recessive, meaning they have two copies of the recessive allele. Use lowercase letters to represent recessive alleles (e.g., bb for blue eyes).
Step 4: Work backwards from recessive individuals For every person showing the recessive characteristic, trace back to determine what alleles they must have inherited from each parent. This helps you figure out the genotypes of the parents.
Step 5: Determine dominant genotypes If parents show the dominant trait but have children with the recessive trait, they must be heterozygous (carrying one dominant and one recessive allele). Use capital letters for dominant alleles (e.g., B for brown eyes).
Step 6: Complete remaining genotypes Other individuals showing the dominant characteristic will most likely be either homozygous dominant (BB) or heterozygous dominant (Bb).
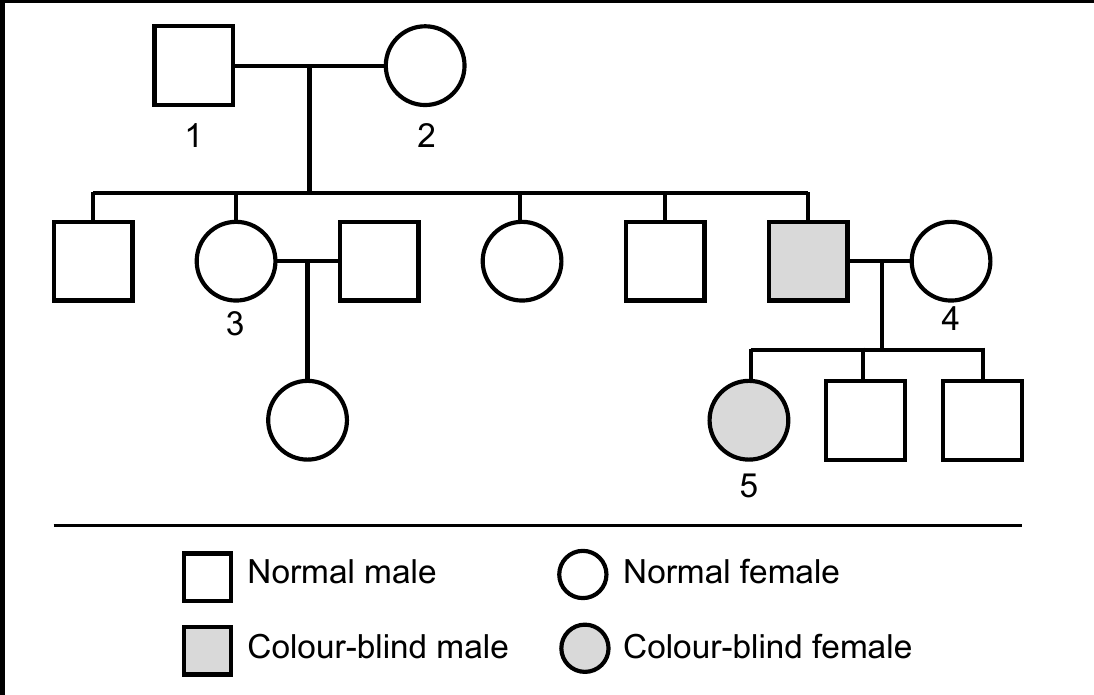
This diagram illustrates the inheritance pattern of colour blindness, which is a sex-linked recessive trait.
Types of inheritance patterns
Pedigree diagrams can reveal different types of inheritance patterns, each with distinctive characteristics.
Autosomal dominant inheritance
In this pattern, the trait appears in every generation and is passed from affected parents to their children. Both males and females are equally likely to be affected.
Autosomal recessive inheritance
Here, the trait often skips generations and appears when both parents are carriers. Children of two carrier parents have a 25% chance of expressing the trait.
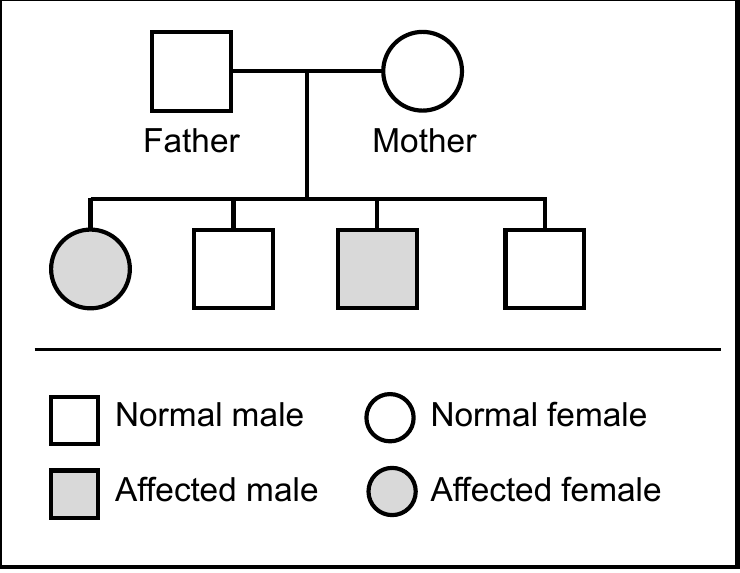
This simple pedigree shows a typical pattern where both parents must be carriers for children to express a recessive trait.
Sex-linked inheritance
Some traits are carried on the X chromosome, making them more common in males since they only need one copy of the allele to express the trait. Females need two copies to express X-linked recessive traits.
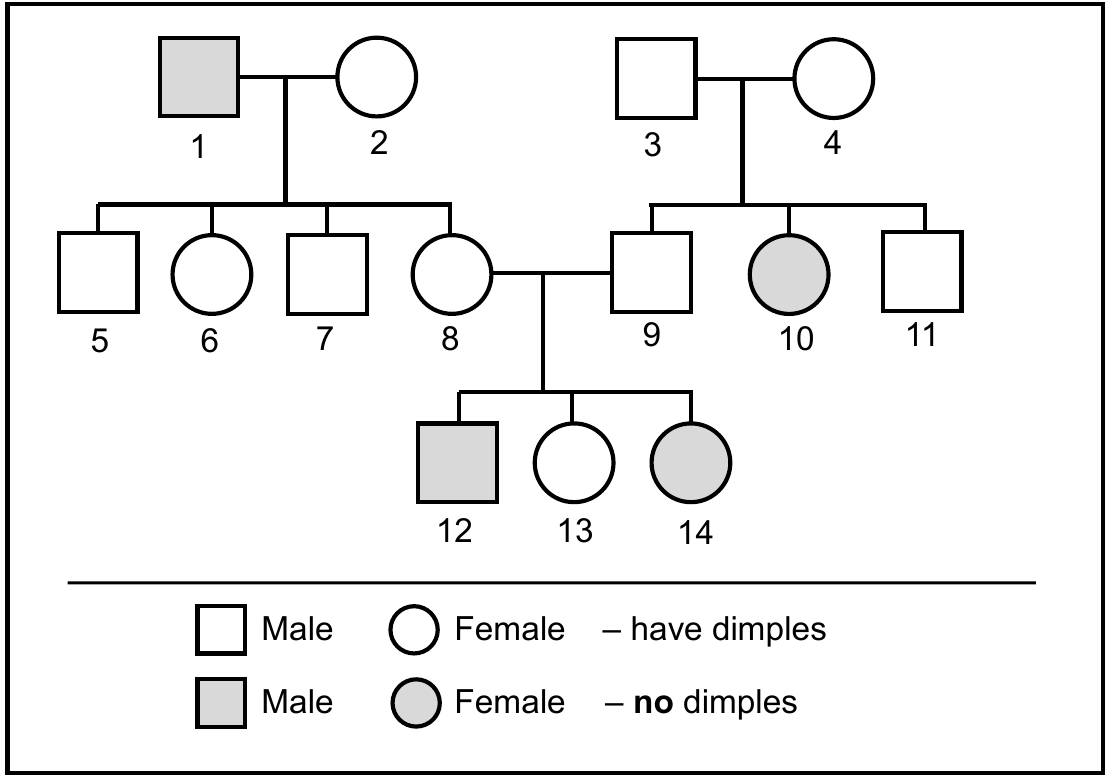
This pedigree tracks the inheritance of dimples across multiple generations, showing how dominant traits are expressed.
Practical applications
Pedigree analysis has many real-world applications in genetics and medicine. Genetic counsellors use these diagrams to help families understand the risk of inherited conditions. Medical professionals can predict the likelihood of genetic disorders appearing in future generations and provide appropriate advice to prospective parents.
In South Africa, pedigree analysis is particularly important for understanding the inheritance patterns of genetic conditions that may be more common in certain populations, helping healthcare providers offer better genetic counselling services.
Common misconceptions and exam tips
Common misconception: Students often confuse dominant and recessive patterns. Remember that dominant traits typically appear in every generation, while recessive traits may skip generations.
Exam tip: Always start by identifying whether the trait is dominant or recessive before attempting to determine genotypes. Look for the pattern - if both parents don't have the trait but their child does, the trait is recessive.
Exam tip: When dealing with sex-linked traits, remember that affected males cannot pass the trait to their sons, only to their daughters who become carriers.
Exam tip: Use systematic notation - always use the same letter for the same trait throughout your analysis (e.g., B/b for eye colour, D/d for dimples).
Remember!
Key Points to Remember:
- Pedigree diagrams are family trees that track inheritance patterns across generations
- Squares = males, circles = females, horizontal lines = mating, vertical lines = offspring relationships
- Follow the six-step interpretation process systematically for accurate analysis
- Dominant traits usually appear in every generation, while recessive traits may skip generations
- Sex-linked traits show distinctive patterns, affecting males more frequently than females