Measures of Spread (Grade 12 NSC Matric Mathematical Literacy): Revision Notes
Measures of Spread
Range
Range is the simplest measure of spread in a data set. It tells you how spread out your data values are by measuring the difference between the largest and smallest values.
Definition and formula
The range shows the total spread of your data from the lowest to the highest value. It gives you a quick idea of how varied your data is.
A small range means your values are clustered close together, while a large range suggests your values are more spread out across a wider area.
Worked Example: Range Calculation
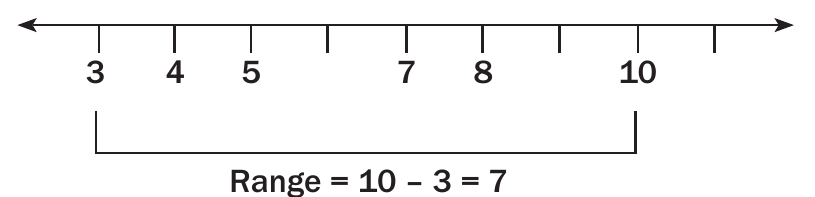
Find the range for death fatalities that occurred over 6 months on the N4 highway: 3, 7, 8, 5, 4, 10.
Step 1: Identify the values
- Data set: 3, 7, 8, 5, 4, 10
Step 2: Find the extreme values
- Lowest value = 3
- Highest value = 10
Step 3: Apply the formula
- Range = 10 - 3 = 7
Interpretation: The fatalities varied by 7 deaths across the 6-month period.
Limitations of Range
The range only considers the two extreme values (minimum and maximum). This can be misleading if you have outliers — extremely high or low values that don't represent the typical data.
Quartiles
Quartiles divide your data into four equal parts, with each part containing 25% of the data values. This gives you a more detailed picture of how your data is distributed.
Understanding quartiles
To find quartiles, you need to:
- First find the median (Q₂) — this divides your data into two equal halves
- Find Q₁ (first quartile) — the median of the lower half
- Find Q₃ (third quartile) — the median of the upper half

Five Number Summary
The five number summary uses five key values to describe your data:
- Minimum: Smallest value
- Q₁: First quartile (25% of data below this)
- Q₂: Second quartile/Median (50% of data below this)
- Q₃: Third quartile (75% of data below this)
- Maximum: Largest value
Worked Example: Finding Quartiles
Using Statistics South Africa data on fatal crashes for November and December 2011:
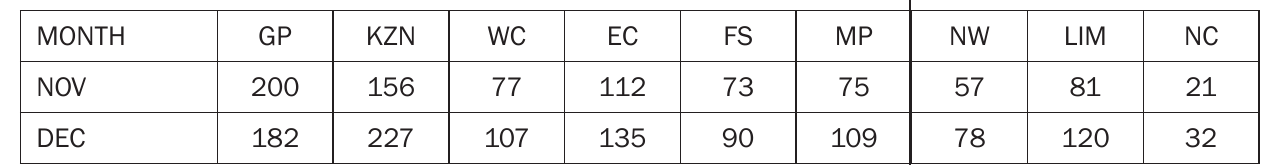
November data (arranged in order): 21, 57, 73, 75, 77, 81, 112, 156, 200
Step 1: Find the minimum and maximum
- Minimum = 21
- Maximum = 200
Step 2: Find the median (Q₂)
- Median (Q₂) = 77 (middle value of 9 values)
Step 3: Find Q₁ (median of lower half)
- Lower half: 21, 57, 73, 75
- Q₁ = (57 + 73) ÷ 2 = 65
Step 4: Find Q₃ (median of upper half)
- Upper half: 81, 112, 156, 200
- Q₃ = (112 + 156) ÷ 2 = 134
December data results:
- Minimum = 32, Maximum = 227
- Median (Q₂) = 109
- Q₁ = 84, Q₃ = 158.5
Interquartile Range
The interquartile range (IQR) measures the spread of the middle 50% of your data. It's the difference between the third quartile and the first quartile.
Definition and formula
The IQR tells you how spread out the central portion of your data is, ignoring extreme values.
Worked Example: Calculating IQR
November:
IQR = Q₃ - Q₁ = 134 - 65 = 69
December:
IQR = Q₃ - Q₁ = 158.5 - 84 = 74.5
Interpretation: December shows a slightly larger IQR, meaning the middle 50% of crash data was more spread out in December than November.
Percentiles
Percentiles divide your data into 100 equal groups. They're particularly useful for comparing individual values to a larger population or standard.
Understanding percentiles
Common percentiles include:
- 5th percentile — 5% of values below
- 25th percentile (Q₁) — 25% below, 75% above
- 50th percentile (Q₂/Median) — 50% below, 50% above
- 75th percentile (Q₃) — 75% below, 25% above
- 95th percentile — 95% below, 5% above
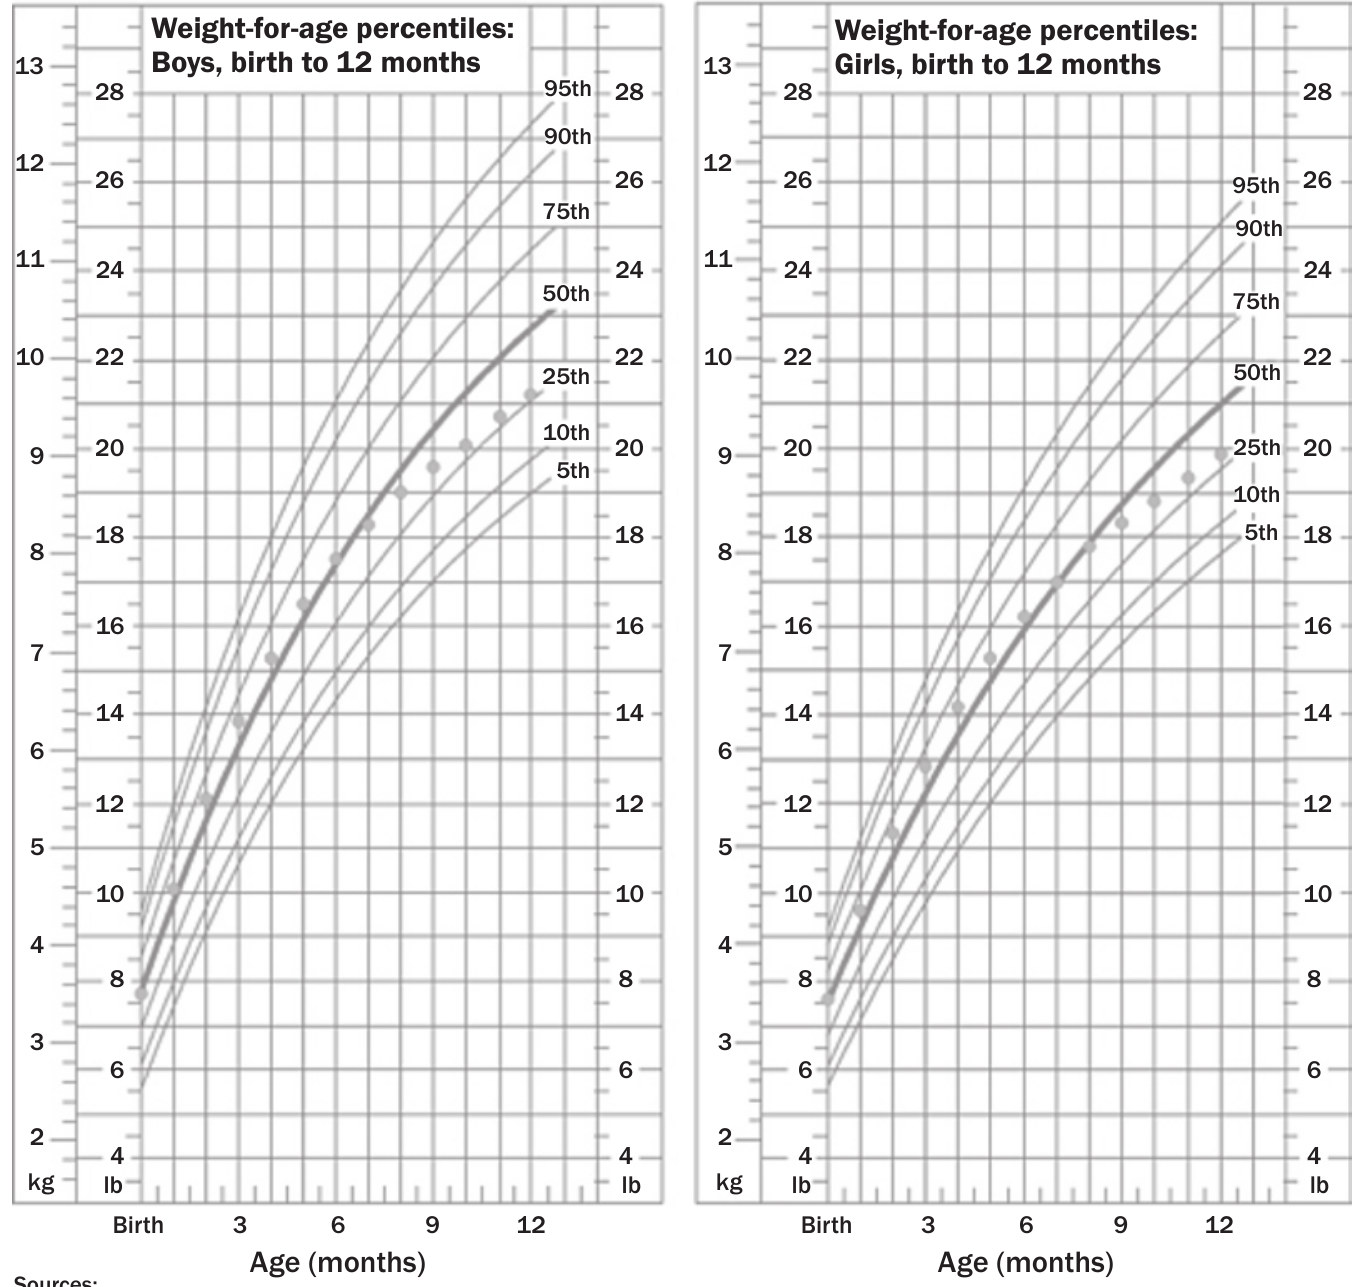
Applications in health and growth
Percentiles are commonly used in growth charts and health assessments.
If a child's weight is at the 75th percentile, it means 75% of children weigh less and 25% weigh more.
BMI Percentile Classifications
| BMI for Age Percentile Range | Weight Status |
|---|---|
| Less than 5th percentile | Underweight |
| 5th to less than 85th percentile | Healthy |
| 85th to less than 95th percentile | Risk of overweight |
| 95th percentile and above | Overweight |
Worked Example: Using Growth Charts
Scenario 1: A 4-year-old girl has a BMI at the 95th percentile.
→ Her BMI is higher than 95% of girls her age.
→ She would be considered overweight.
Scenario 2: A 10-year-old child has a BMI of 16 kg/m², between the 25th and 50th percentiles.
→ 25% have lower BMI, 50% higher.
→ The child is within the healthy weight range.
Exam Tips
- Always arrange data in order before finding quartiles
- Remember the range formula: Highest − Lowest
- IQR is more reliable than range when outliers are present
- Percentiles help compare individuals to populations
- Check that
- Use percentiles to interpret comparisons
Key Points to Remember:
- Range = Highest − Lowest (simple but affected by outliers)
- Quartiles divide data into four equal parts
- IQR = measures spread of middle 50%
- Percentiles divide data into 100 equal groups
- Five-number summary: Min, Q₁, Q₂, Q₃, Max
- IQR is more resistant to outliers than range