Direct and Indirect Proportion (Grade 12 NSC Matric Mathematical Literacy): Revision Notes
Direct and Indirect Proportion
What are proportion relationships?
Some relationships between quantities create patterns that form either direct proportion or indirect proportion graphs. Understanding these relationships helps you recognise how quantities change together and predict their behaviour.
Proportion relationships are fundamental in mathematics and appear frequently in real-world scenarios, from cooking recipes to business calculations.
Direct proportion
Direct proportion occurs when two quantities change in the same way - as one increases, the other increases by the same factor, and as one decreases, the other decreases by the same factor.
How to recognise direct proportion relationships
In a direct proportion, when one quantity gets multiplied, the other quantity gets multiplied by exactly the same number. This creates a straight-line graph that always passes through the origin point (0; 0).
For example, if the number of lamps sold doubles, the income also doubles. This shows a direct proportional relationship between lamps sold and income earned.
The mathematical relationship for direct proportion can be written as , where is a constant value.
Indirect proportion
Indirect proportion (also called inverse proportion) occurs when two quantities change in opposite ways - as one quantity increases, the other quantity decreases, or vice versa.
How to recognise indirect proportion relationships
In an indirect proportion, as one quantity gets bigger, the other quantity gets smaller. The key feature is that when you multiply the two quantities together, the result (called the product) always stays the same.
This constant product is the defining characteristic of indirect proportion relationships. If (where is constant), then you have an indirect proportion.
Worked example: Rectangle with fixed area
Let's examine a rectangle that has a fixed area of 32 square units. The length and breadth can both change, but because the area stays the same, they show an indirect proportion relationship.
Worked Example: Rectangle with Fixed Area
Step 1: Complete the table of possible values
When the area must always equal 32 square units, we can calculate the breadth for each length:
- Therefore:
| Length | 1 | 2 | 4 | 8 | 16 | 32 |
|---|---|---|---|---|---|---|
| Breadth | 32 | 16 | 8 | 4 | 2 | 1 |
Step 2: Observe the pattern
Notice how as the length doubles each time (1 → 2 → 4 → 8 → 16 → 32), the breadth halves each time (32 → 16 → 8 → 4 → 2 → 1). This is a perfect example of indirect proportion.
Step 3: Check the constant product
The product is always 32, confirming this is an indirect proportion.
Graph interpretation
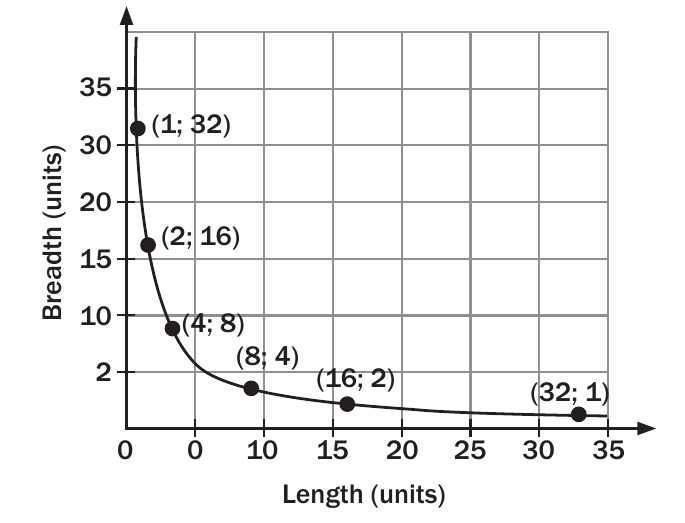
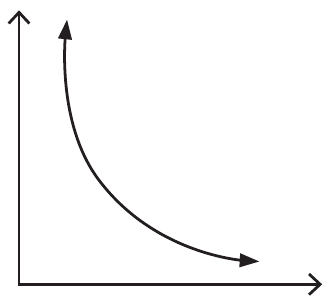
When we plot these values on a graph, we get a smooth curve called a rectangular hyperbola. The graph shows several important features:
Understanding the Continuous Curve
The measurement values represent continuous quantities, so the graph forms a continuous curve rather than just discrete points. This means there are infinitely many possible combinations of length and breadth that maintain the area of 32 square units.
- Length and breadth cannot equal zero (you cannot have a rectangle with zero length or breadth), so the graph never touches either axis
- Each point on the curve represents a valid combination of length and breadth that gives an area of 32
Key characteristics of inverse proportion graphs
The important features of an inverse proportion graph are:
- Smooth curve shape: The graph forms a smooth, curved line (not straight)
- Never touches the axes: The curve approaches but never actually reaches either the x-axis or y-axis
- Constant product: At any point on the curve, multiplying the x-coordinate by the y-coordinate gives the same result
This type of curve is called a rectangular hyperbola and is the characteristic shape for all indirect proportion relationships. The mathematical form is where is constant.
Key Points to Remember:
- Direct proportion creates straight-line graphs passing through (0,0) - both quantities change by the same factor
- Indirect proportion creates curved graphs that never touch the axes - as one quantity increases, the other decreases
- In indirect proportion, the product of the two quantities always remains constant
- Rectangular hyperbola is the name for the curved graph shape of inverse proportion
- The curve never touches the axes because the quantities cannot equal zero in most real-world scenarios