Exponential Number Patterns and Graphs (Grade 12 NSC Matric Mathematical Literacy): Revision Notes
Exponential Number Patterns and Graphs
What is exponential growth?
Exponential growth occurs when a quantity increases in such a way that the graph starts by increasing slowly and then increases very rapidly. This creates a distinctive curved shape that becomes steeper over time.
The main characteristic of exponential growth is that each increase is proportional to the current amount, rather than adding the same fixed amount each time. This means the rate of growth accelerates as the quantity gets larger.
This pattern differs significantly from linear growth, which shows a constant rate of increase and produces a straight-line graph.
Linear growth vs exponential growth
Understanding the fundamental differences between these two growth patterns is essential for recognising them in real-world situations.
Linear Growth Characteristics:
- Produces a straight-line graph
- Has a constant difference between consecutive values
- Shows the same amount of increase in each time period
- Rate of change remains steady throughout
Exponential Growth Characteristics:
- Creates a curved graph that gets progressively steeper
- Has a constant ratio between consecutive values
- Shows an increasing amount of change in each time period
- Rate of change accelerates over time
The key difference: Linear growth has a constant difference between terms, while exponential growth has a constant ratio between terms. This is the most reliable way to distinguish between the two patterns.
Worked example: Comparing growth patterns
Let's examine two scenarios that clearly demonstrate the difference between linear and exponential patterns.
Worked Example: Tree Planting vs Sheep Population
Scenario 1: Fruit tree planting (Linear growth)
- A farmer starts with 20 fruit trees
- Plants 20 additional trees each year
- The number of trees increases by exactly 20 each year
- This creates a constant difference of 20
Scenario 2: Sheep population (Exponential growth)
- A farmer starts with 10 sheep
- Each sheep produces another sheep every year (population doubles)
- The number of sheep multiplies by 2 each year
- This creates a constant ratio of 2
| Year | Trees | Difference | Sheep | Ratio |
|---|---|---|---|---|
| 0 | 20 | - | 10 | - |
| 1 | 40 | +20 | 20 | ×2 |
| 2 | 60 | +20 | 40 | ×2 |
| 3 | 80 | +20 | 80 | ×2 |
| 4 | 100 | +20 | 160 | ×2 |
| 5 | 120 | +20 | 320 | ×2 |
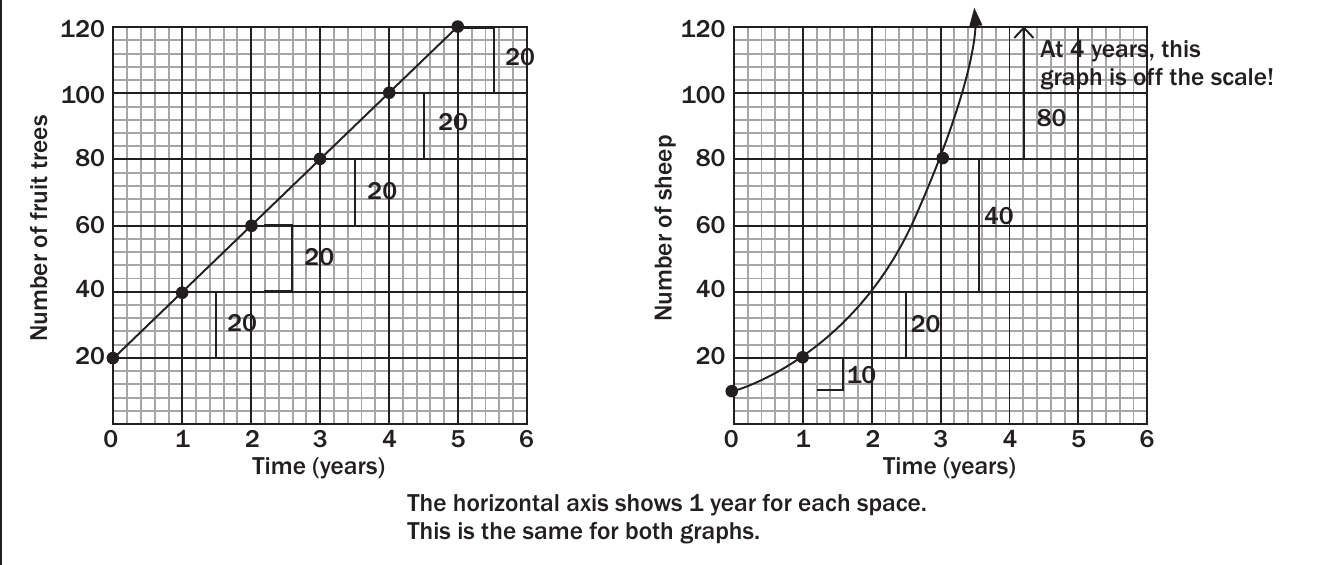
Notice how the sheep population overtakes the tree count by year 3. By year 4, the exponential growth becomes so rapid that it exceeds the scale of a typical graph, demonstrating the explosive nature of exponential patterns.
Key characteristics for identification
When analysing data patterns, use these distinguishing features:
Linear Patterns:
- Straight-line graphs
- Linear number patterns with arithmetic progression
- Constant difference between consecutive terms
- Predictable, steady increases
Exponential Patterns:
- Curved graphs showing compound or exponential growth
- Geometric progression with constant multiplication
- Constant ratio between consecutive terms
- Accelerating increases over time
The constant ratio is the key identifier for exponential growth. In the sheep example, dividing any term by the previous term always gives 2.
Real-world application: Compound interest
Compound interest provides an excellent example of exponential growth in financial contexts.
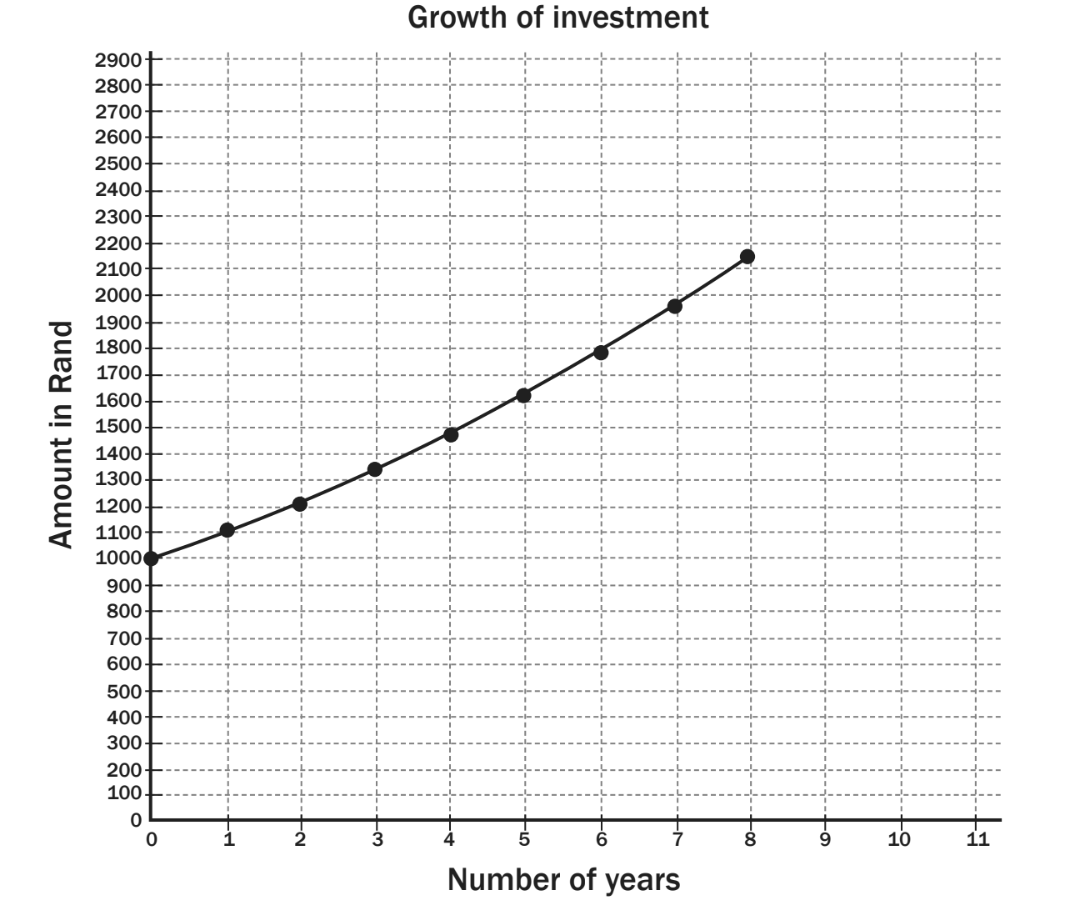
Worked Example: Investment Growth with Compound Interest
Thembi invests R1,000 at 10% compound interest per year. The interest is calculated on the total amount in the account each year, not just the original investment.
| Year | Calculation | Amount (R) |
|---|---|---|
| 0 | Initial investment | 1,000.00 |
| 1 | 10% of R1,000 + R1,000 = R1,100 | 1,100.00 |
| 2 | R1,100 × 1.1 | 1,210.00 |
| 3 | R1,210 × 1.1 | 1,331.00 |
| 4 | R1,331 × 1.1 | 1,464.10 |
| 5 | R1,464.10 × 1.1 | 1,610.51 |
| 8 | Continued growth | 2,143.59 |
Key insight: Each year, the 10% interest is calculated on the new total amount. This means:
- Year 1: Interest = R100 (10% of R1,000)
- Year 2: Interest = R110 (10% of R1,100)
- Year 3: Interest = R121 (10% of R1,210)
The interest amount itself grows each year, creating exponential growth.
Year 0 represents the starting point when the initial investment is made. This is where exponential growth patterns typically begin their measurement.
How to identify exponential patterns
Follow these steps when analysing number sequences or graphs:
- Calculate consecutive differences: If these keep increasing, consider exponential growth
- Calculate consecutive ratios: If these remain constant, it confirms exponential growth
- Examine graph shape: Exponential graphs curve upward with increasing steepness
- Check growth behaviour: Exponential growth starts slowly but accelerates rapidly
Common types of exponential growth
Population growth: Many biological populations double at regular intervals when resources are abundant, like the sheep example.
Compound interest: Financial growth where interest earns additional interest, creating exponential increases in investments or debt.
Technology adoption: New technologies often spread through populations following exponential patterns as early adopters influence others.
Viral spread: Disease transmission and information sharing through social media often follow exponential patterns initially.
Exam tips
Essential Exam Strategies:
- Always check both differences AND ratios when identifying pattern types - this helps distinguish between linear and exponential growth
- Remember exponential graphs start gently - the initial slow growth can be misleading before the rapid acceleration
- Understand Year 0 - this represents the starting point or initial condition, not the absence of time
- Use constant ratios to predict future values in exponential sequences by multiplying the last known term
- Watch graph scales carefully - exponential growth can quickly exceed normal graph limits, requiring scale adjustments
Key Points to Remember:
-
Exponential growth creates curved graphs that start slowly but accelerate rapidly, unlike linear growth which maintains constant increases
-
Constant differences indicate linear patterns while constant ratios confirm exponential patterns between consecutive terms
-
Compound interest demonstrates real-world exponential growth where interest calculations are based on the growing total amount
-
Pattern identification requires checking whether differences or ratios remain constant across the sequence
-
Graph scales can quickly become inadequate for exponential growth, showing how rapidly these patterns can escalate beyond normal expectations