Graphs Going Up (Increasing) and Down (Decreasing) (Grade 12 NSC Matric Mathematical Literacy): Revision Notes
Graphs Going Up (Increasing) and Down (Decreasing)
Understanding whether a graph is increasing or decreasing is a fundamental skill in mathematical literacy. This concept helps us interpret data trends and make sense of real-world information presented in graphical form.
What are increasing and decreasing graphs
Increasing graphs are lines or curves that rise upwards as you move from left to right across the graph. When a graph is increasing, the values on the vertical axis (y-axis) become larger as the values on the horizontal axis (x-axis) increase.
Decreasing graphs are lines or curves that fall downwards as you move from left to right across the graph. When a graph is decreasing, the values on the vertical axis become smaller as the values on the horizontal axis increase.
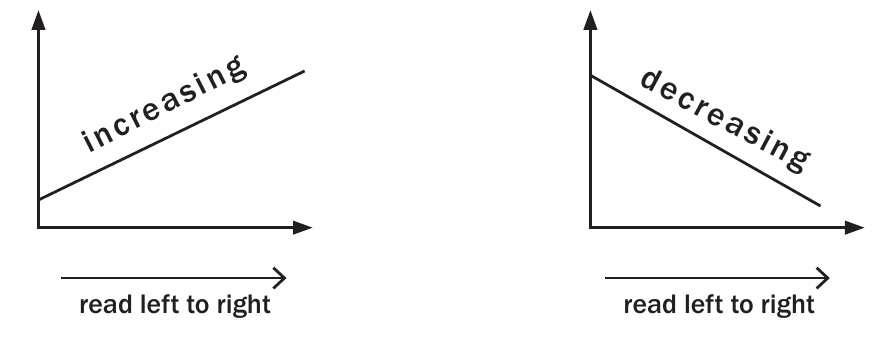
The key rule to remember is simple: always read graphs from left to right, just like reading a book. This consistent approach will help you correctly identify whether a graph shows an increasing or decreasing trend.
How to determine if a graph is increasing or decreasing
To determine whether a graph is increasing or decreasing, follow these systematic steps:
- Start from the left side of the graph
- Move your eyes to the right following the line or curve
- Observe the direction: Does the line go up or down?
- If the line goes upward, the graph is increasing
- If the line goes downward, the graph is decreasing
Practical Example: The Finger Method
A helpful technique is to place your finger on the graph and trace along the line from left to right. Ask yourself: "Does the graph rise up to the right (increase) or go down to the right (decrease)?"
This physical tracing method helps eliminate confusion and ensures you're reading the graph in the correct direction.
Understanding slopes and rate of change
Not all increasing or decreasing graphs change at the same rate. The slope or gradient of a line tells us how quickly the graph is changing.
Steep slopes vs gentle slopes
Steep slopes indicate a rapid rate of change. When a graph has a steep slope:
- An increasing graph rises quickly
- A decreasing graph falls quickly
- Changes happen fast over short distances
Gentle slopes indicate a gradual rate of change. When a graph has a gentle slope:
- An increasing graph rises slowly
- A decreasing graph falls slowly
- Changes happen slowly over longer distances
Types of slopes you might encounter
Understanding different slope characteristics helps you describe graphs more precisely:
- Steep slope with quick increase: The line rises sharply from left to right
- Quick decrease with steep slope: The line falls sharply from left to right
- Gentle slope with gradual decrease: The line falls slowly from left to right
- Gentle slope with gradual increase: The line rises slowly from left to right
The steepness of a slope is directly related to how dramatically the y-values change compared to the x-values. A steeper line means more dramatic changes over shorter horizontal distances.
Exam tips and common mistakes
Common exam mistake: Students sometimes read graphs from right to left instead of left to right. Always remember to read in the same direction you read text - this is a fundamental rule that applies to all graph interpretation.
When tackling graph questions in exams, precision in your language makes a significant difference in your marks.
Exam tip: When describing graph trends in exams, use precise language:
- Say "the graph increases from left to right" rather than just "the graph goes up"
- Mention the rate of change: "the graph increases steeply" or "the graph decreases gradually"
Quick Check Method
If you're unsure about a graph's direction, imagine walking along the graph from left to right. Would you be walking uphill (increasing) or downhill (decreasing)? This visualisation technique helps clarify the graph's behaviour.
Real-world applications
Understanding increasing and decreasing graphs is essential for interpreting various types of data you encounter in daily life and academic studies.
Practical Applications Include:
- Temperature changes over time (weather patterns, seasonal variations)
- Population growth or decline (demographic studies, wildlife populations)
- Sales figures across months (business performance, market trends)
- Distance travelled during a journey (travel analysis, speed calculations)
- Bank account balances over time (financial planning, spending patterns)
Each of these real-world examples demonstrates how the concept of increasing and decreasing graphs helps us understand and analyse patterns in data.
Key Points to Remember:
- Always read graphs from left to right - this is the standard convention for interpreting all graphs
- Increasing graphs go upward from left to right, showing values getting larger
- Decreasing graphs go downward from left to right, showing values getting smaller
- Steep slopes show rapid changes while gentle slopes show gradual changes
- Use the finger tracing method when in doubt - trace along the line to see if it goes up or down