How to Identify the Kind of Relationship in a Graph (Grade 12 NSC Matric Mathematical Literacy): Revision Notes
How to Identify the Kind of Relationship in a Graph
Understanding the shape and characteristics of graphs is essential for interpreting mathematical relationships. By examining the visual features of a graph, you can determine what type of relationship exists between two quantities. This skill is crucial for mathematical literacy as it helps you make sense of data patterns and predict future trends.
Graph identification is a fundamental skill in Mathematical Literacy that appears frequently in examinations. Mastering these patterns will help you quickly analyse data and make informed predictions in real-world situations.
Linear graphs - not in proportion
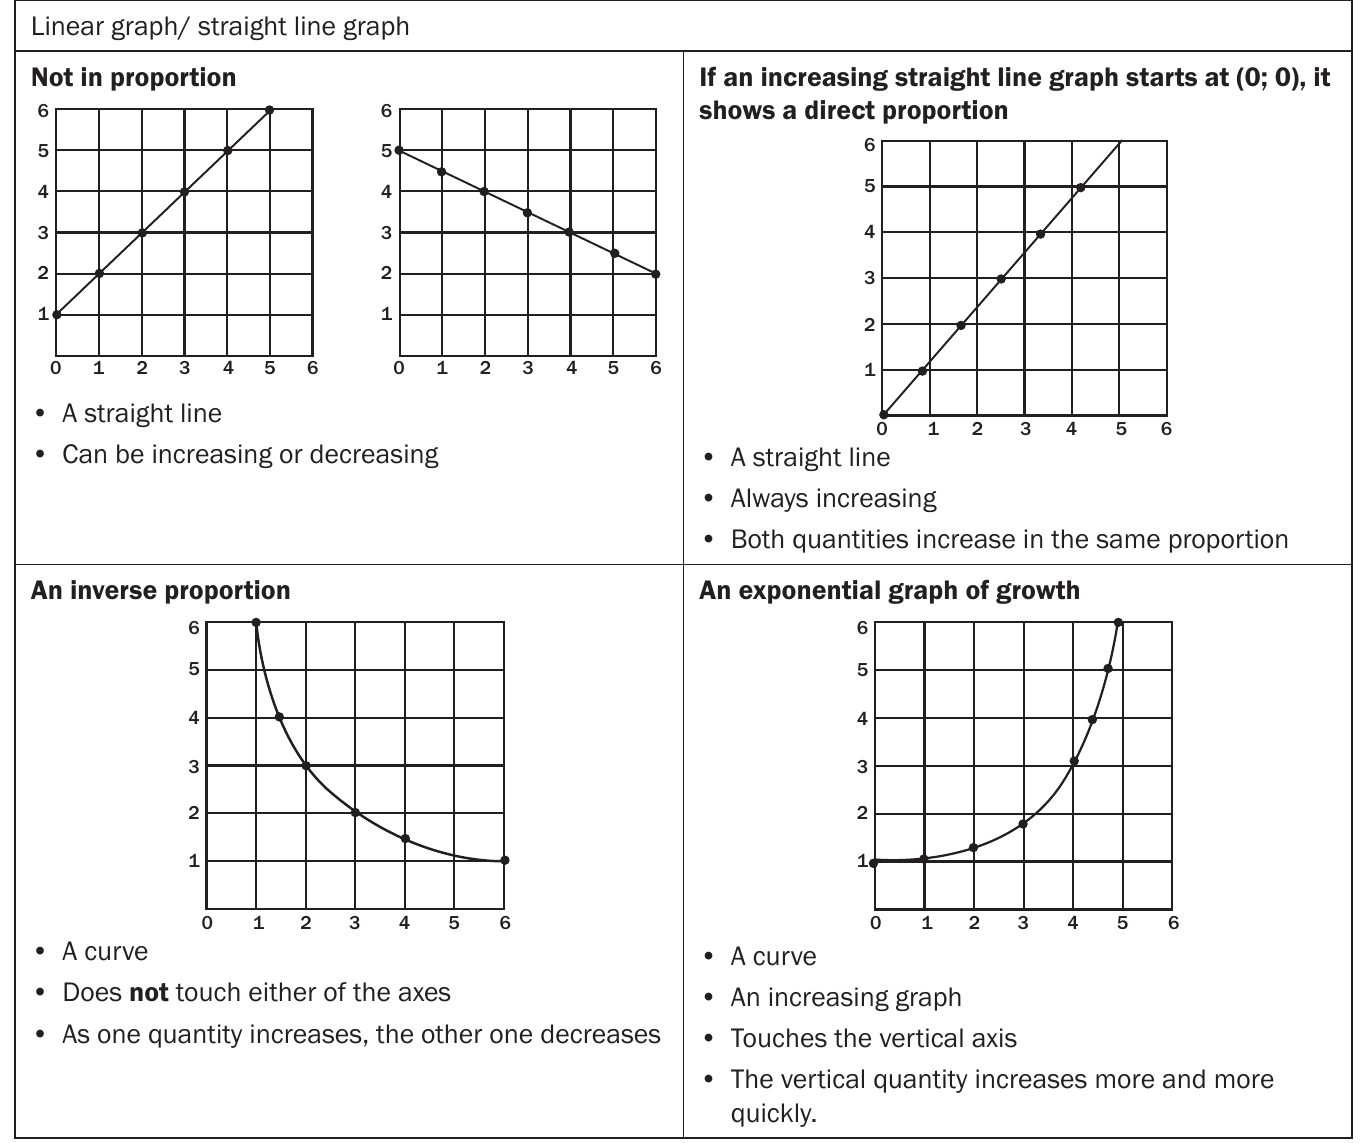
Linear graphs that are not in proportion appear as straight lines on a coordinate plane, but they do not pass through the origin (0,0). These graphs represent relationships where there is a constant rate of change between the two quantities, but the relationship does not start from zero.
Key characteristics:
- The graph forms a straight line
- Can be either increasing (sloping upwards) or decreasing (sloping downwards)
- Does not pass through the origin (0,0)
- Shows a constant rate of change but includes a starting value or offset
Identification tips:
When you see a straight line that doesn't go through the point (0,0), you're looking at a linear relationship that is not proportional. This often occurs in real-life situations where there's a base amount or starting point before the rate of change begins.
Real-world example: A mobile phone contract with a monthly fee plus cost per minute represents a linear relationship that's not proportional - there's a base cost even if you make zero calls.
Direct proportion
Direct proportion graphs show a special type of linear relationship where both quantities increase at exactly the same rate. This creates a straight line that always passes through the origin.
Key characteristics:
- Forms a straight line
- Always passes through the origin (0,0)
- Always increasing (has a positive slope)
- Both quantities increase in the same proportion
- If one quantity doubles, the other also doubles
The mathematical relationship for direct proportion can be written as , where is a positive constant called the constant of proportionality.
Identification tips:
Look for a straight line that starts at (0,0) and goes upwards. This is the hallmark of direct proportion. The relationship can be written as y = kx, where k is a constant.
Worked Example: Direct Proportion
If 3 apples cost R15, how much do 7 apples cost?
Step 1: Check if it's direct proportion Cost = 0 when apples = 0 ✓ (passes through origin)
Step 2: Find the constant (R5 per apple)
Step 3: Calculate for 7 apples
Inverse proportion
Inverse proportion graphs show a relationship where one quantity increases whilst the other decreases. These graphs create a distinctive curved shape called a hyperbola.
Key characteristics:
- Forms a curve (not a straight line)
- Does not touch either axis
- As one quantity increases, the other decreases
- The curve gets closer to both axes but never actually touches them
- Shows a reciprocal relationship between the quantities
In inverse proportion, the product of the two quantities always remains constant. This can be written as or , where is a constant.
Identification tips:
Look for a smooth curve that approaches both the horizontal and vertical axes without touching them. The curve will be in either the first and third quadrants (positive relationship) or second and fourth quadrants (negative relationship).
Exponential growth
Exponential growth graphs represent relationships where one quantity increases at an accelerating rate as the other quantity increases. This creates a characteristic curved shape that starts slowly and then rises steeply.
Key characteristics:
- Forms a curve that bends upwards
- Touches the vertical axis (y-axis)
- Shows increasing growth throughout
- The vertical quantity increases more and more quickly
- Growth rate accelerates as the horizontal value increases
Identification tips:
Look for a curve that starts relatively flat near the y-axis and then rises more and more steeply. The growth appears slow at first but becomes dramatically faster. This J-shaped curve is typical of exponential relationships.
Common examples of exponential growth: Population growth, compound interest, viral spread, and bacterial multiplication all follow exponential patterns in ideal conditions.
Critical Exam Strategy
When identifying graph types in your Mathematical Literacy exam:
- Check the origin first - Does the line or curve pass through (0,0)?
- Look at the shape - Is it straight or curved?
- Consider the direction - Is it increasing, decreasing, or doing both?
- Examine the rate of change - Is it constant or accelerating?
Key Points to Remember:
- Direct proportion: Straight line through the origin (0,0) - both quantities increase together proportionally
- Not in proportion: Straight line but doesn't pass through the origin - constant rate of change with an offset
- Inverse proportion: Curved line that doesn't touch either axis - as one increases, the other decreases
- Exponential growth: Curved line touching the y-axis - growth rate increases rapidly over time
- Shape matters: Straight lines indicate linear relationships, curves indicate non-linear relationships